
EUR/USD Shows 300 Pip Rally Within Bullish ABC Zigzag
EUR/USD
4 hour
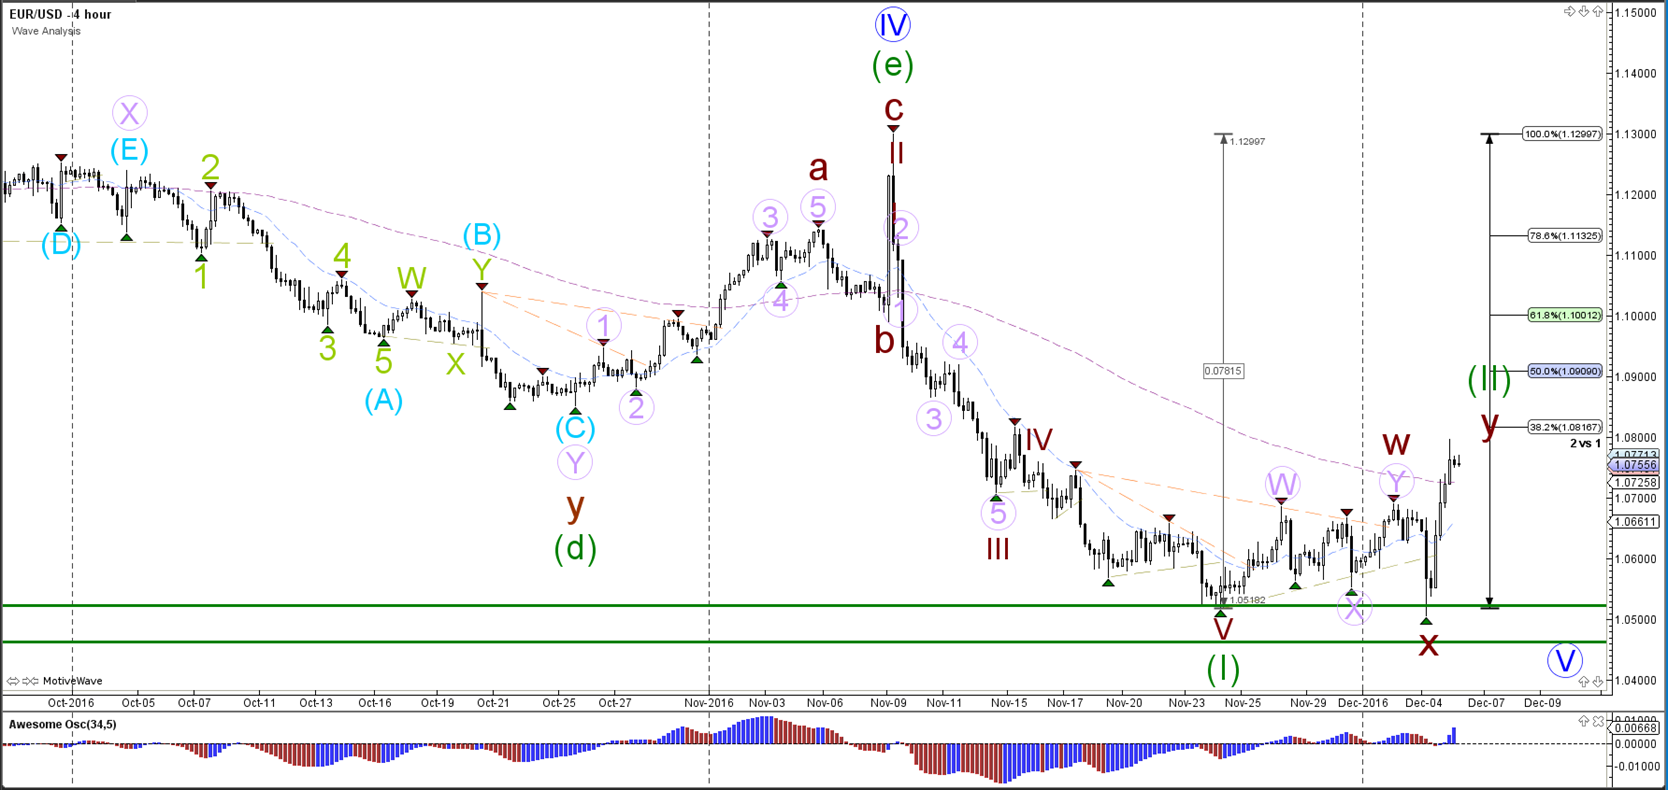
The EUR/USD bounced at the support zone (green lines) as expected and indicated in yesterday's wave analysis. The bullish rally has been strong and impulsive but could face resistance at the Fibonacci levels of wave 2 (green). Waves 2 do tend to retrace deep so price might only pause at the 38.2% Fib but eventually retrace to a higher Fib like the 50% level.
1 hour
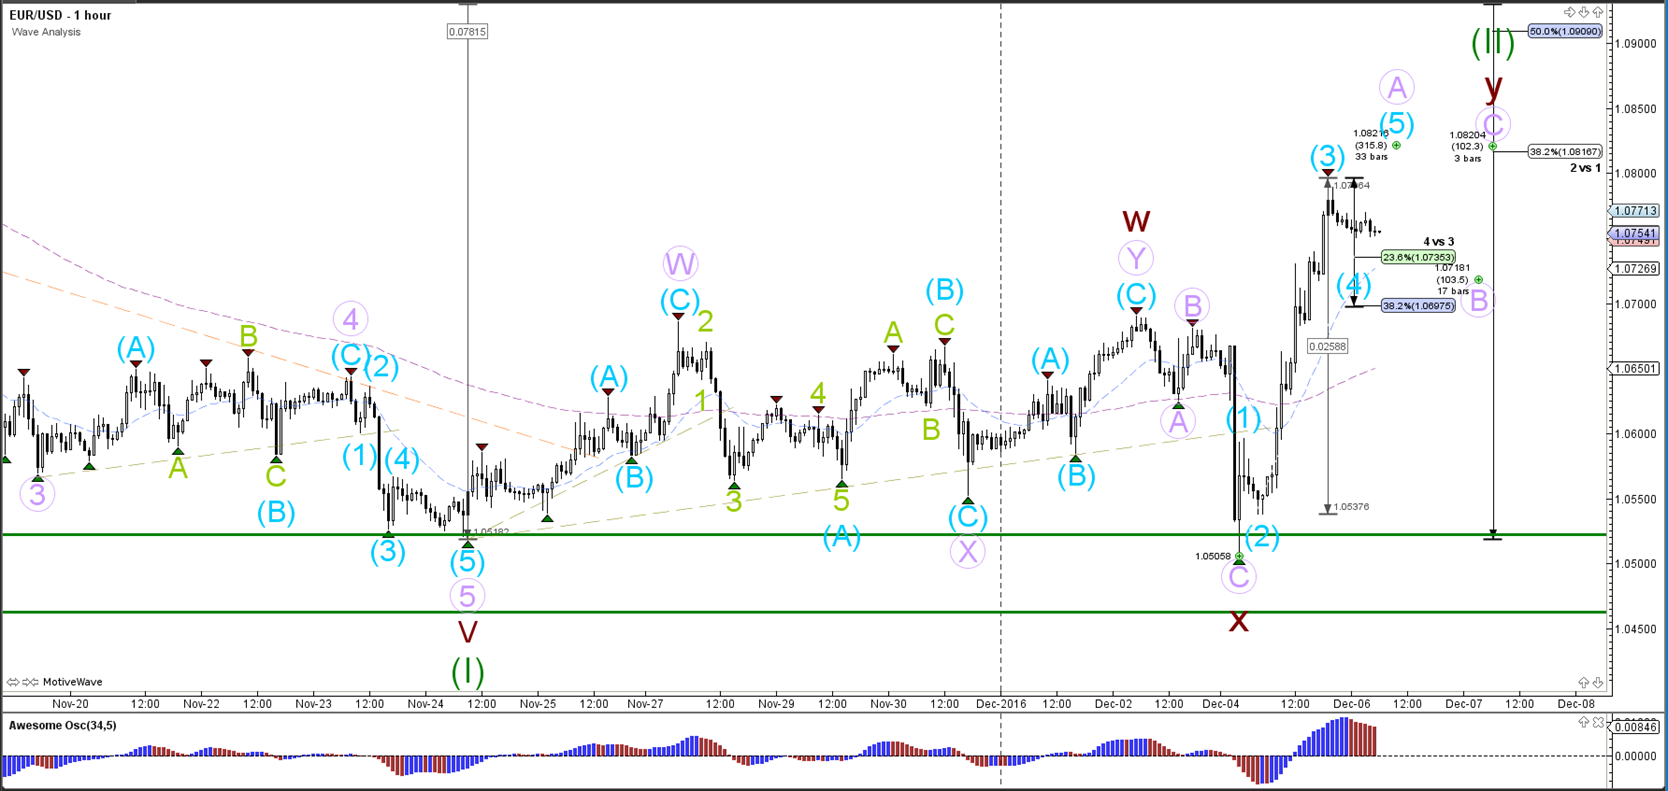
The impulsive bullish rally seems to be a wave 3 (blue) which means that a shallow wave 4 (blue) correction could emerge. The bullish 5 waves could complete (blue) a larger ABC (purple) zigzag within wave 2 (green).
GBP/USD
4 hour
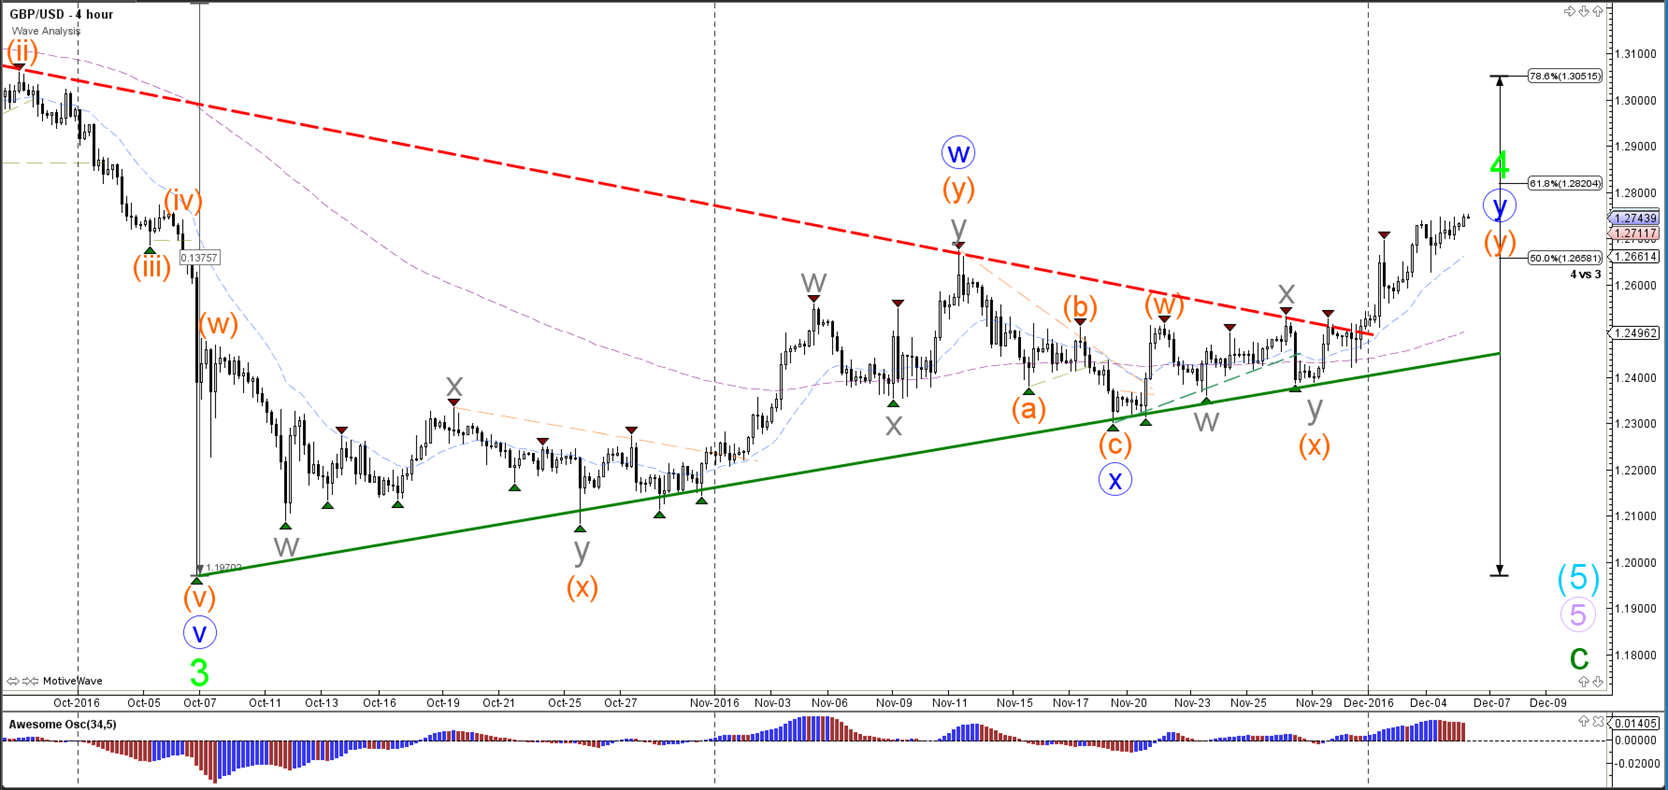
The bullish break above resistance (dotted red) is keeping its momentum but will most likely face a key bounce or break spot at the 61.8% Fibonacci level of wave 4 (green). A break above the 61.8% could also make it likely that a different wave structure is valid (rather than a wave 4).
1 hour
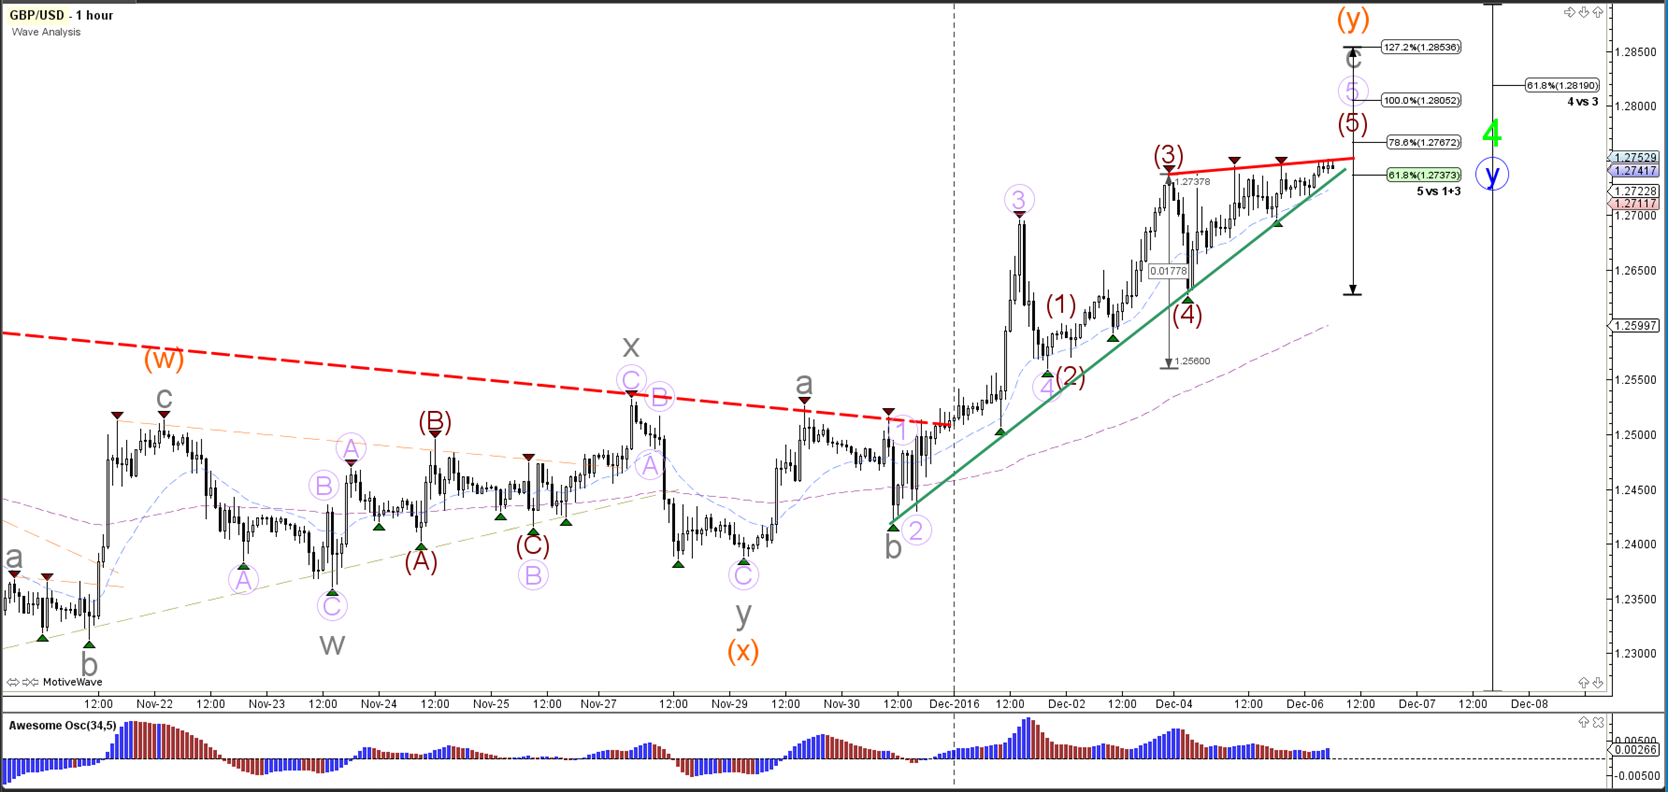
The Cable is building a rising wedge chart pattern (red/green lines) which is typically a bearish reversal pattern. A break below the support trend line could start a new downtrend but the danger of a bullish continuation is always present. A break above the resistance trend line could see price extend wave 5 (brown/purple) towards the Fib targets.
USD/JPY
4 hour
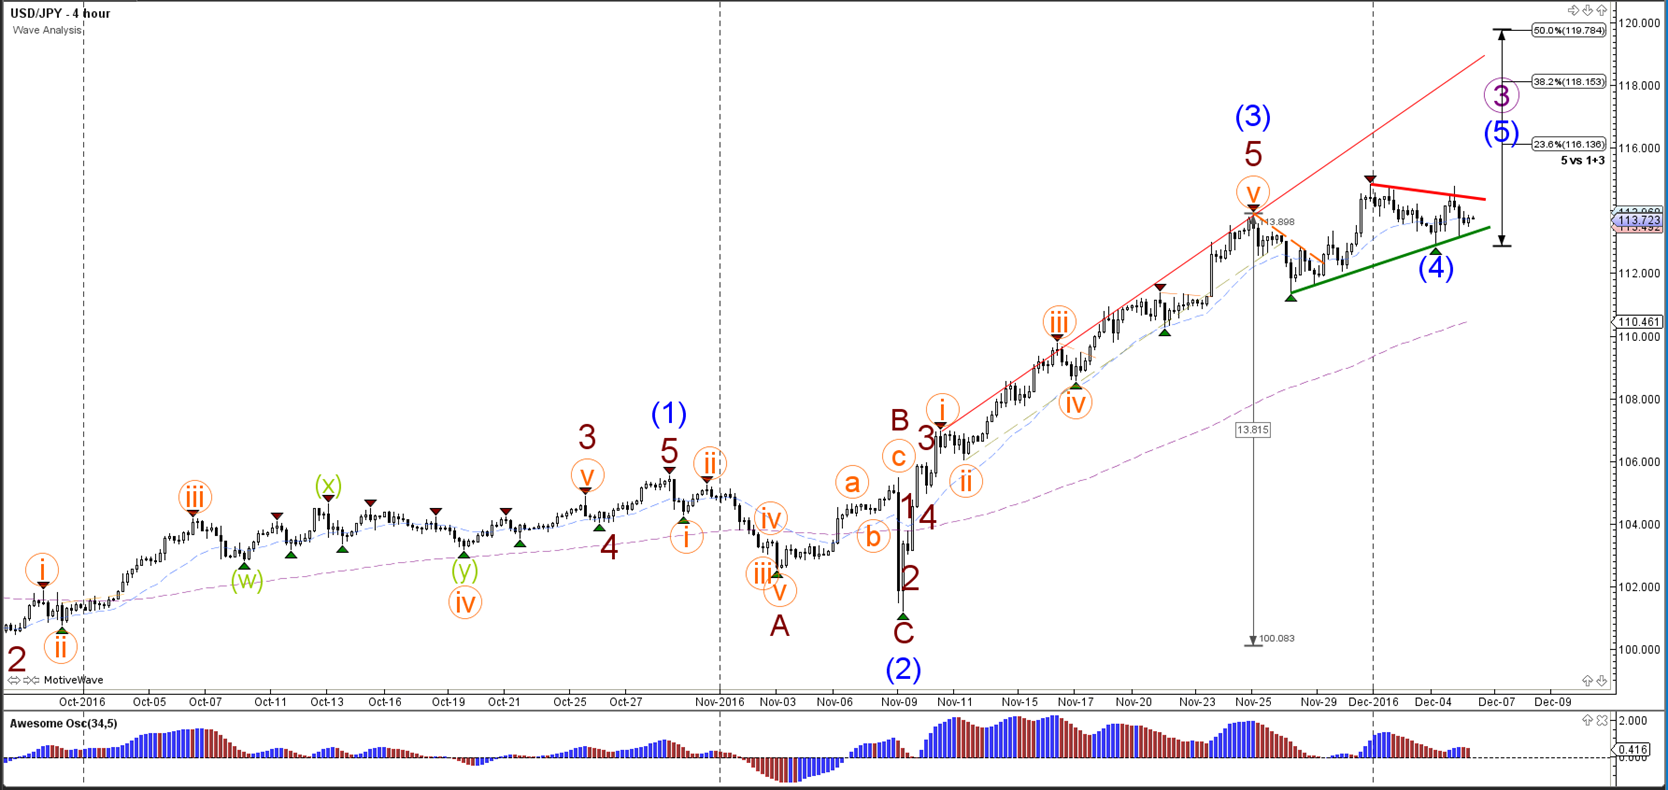
The USD/JPY uptrend is pausing and showing a larger correction with a wave 4 (blue). A break above resistance (red) could see price continue higher towards the Fib targets of wave 5 (blue).
1 hour
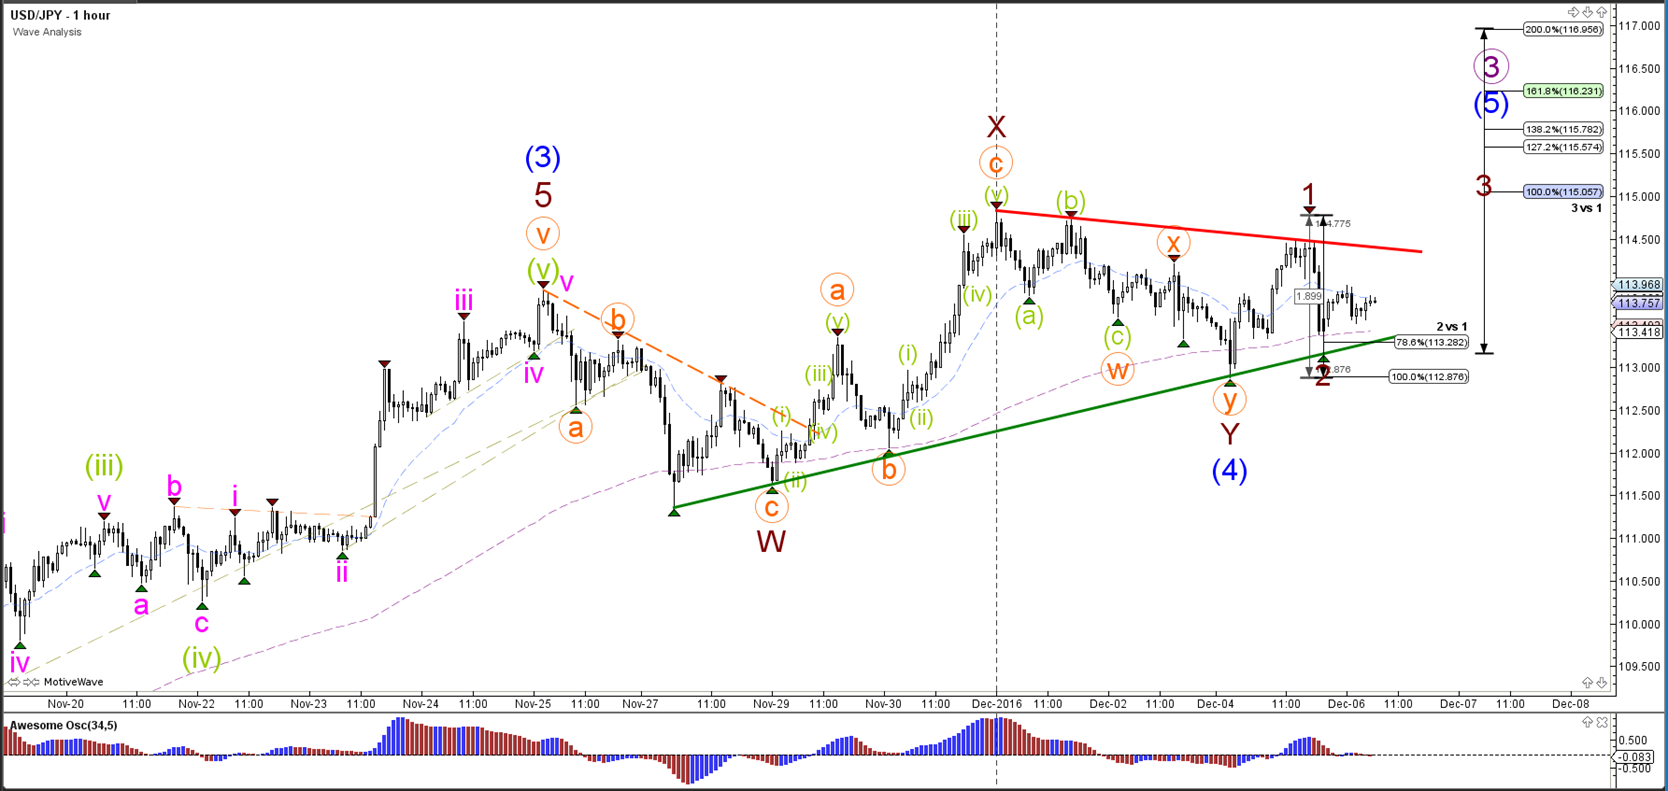
The USD/JPY could be building a 5 wave extension (brown) within the wave 5 (blue). A break below the 100% Fib of wave 2 vs 1 invalidates the wave 2 (brown). A break above resistance (red) could see wave 3 (brown) continue.
Disclosure: None.


