
EUR/USD, GBP/USD Turn Sharply And Open Bullish ABC Zigzag
EUR/USD
4 hour
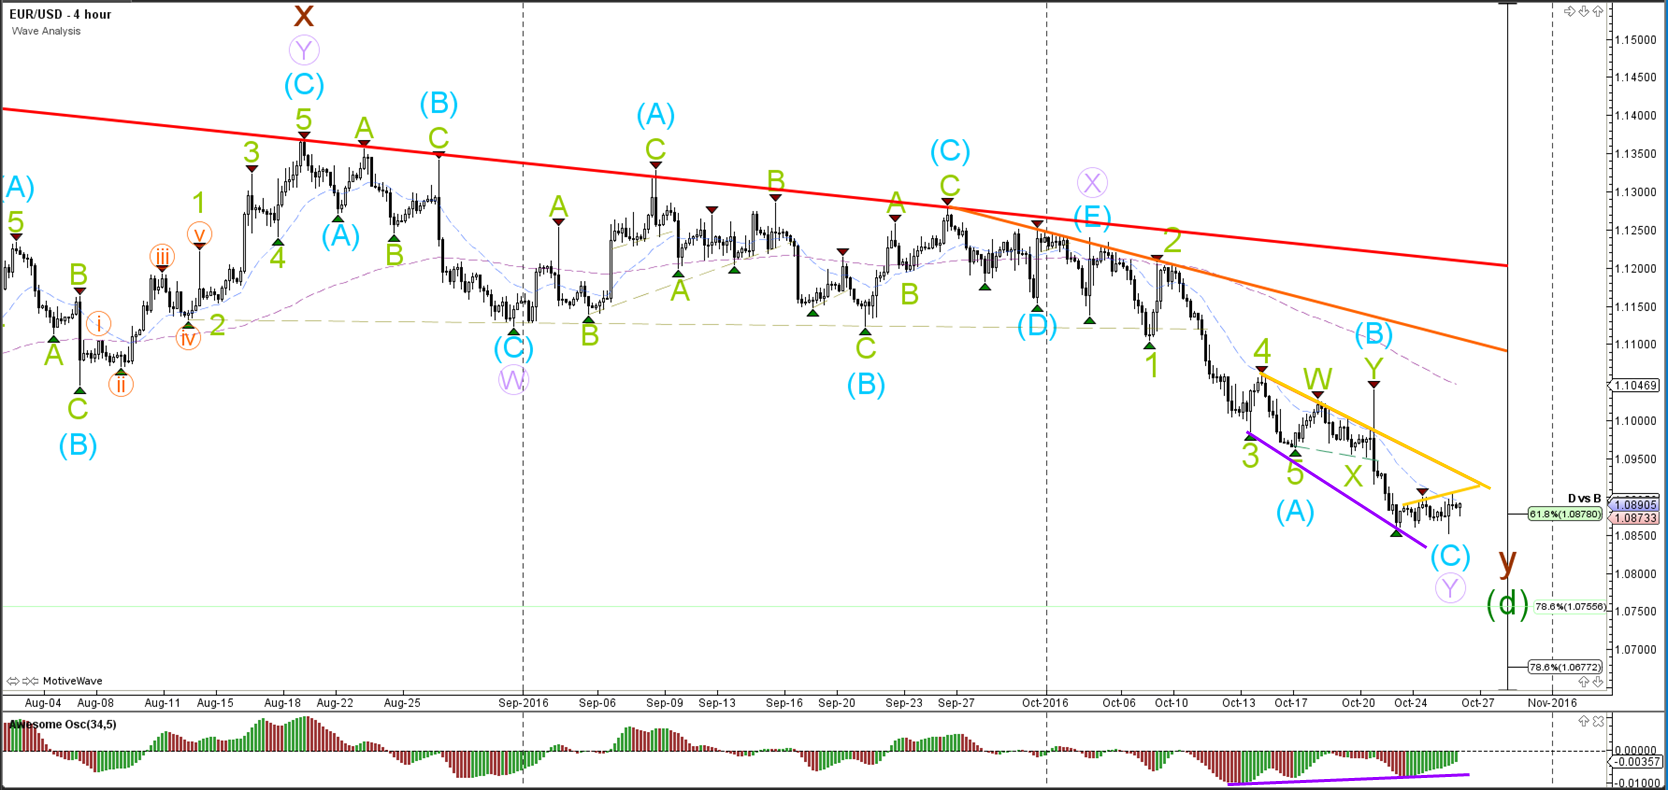
The EUR/USD broke below the support (green) but price did now move far before a strong 4 hour bullish candle appeared. A bullish bounce could be possible despite the downtrend when considering the presence of divergence (purple lines) and the fact that price is still at a 61.8% Fibonacci level. A break above the resistance trend lines (light orange) could confirm the development of a wave d (green) on the daily chart, which is part of a larger weekly triangle.
1 hour
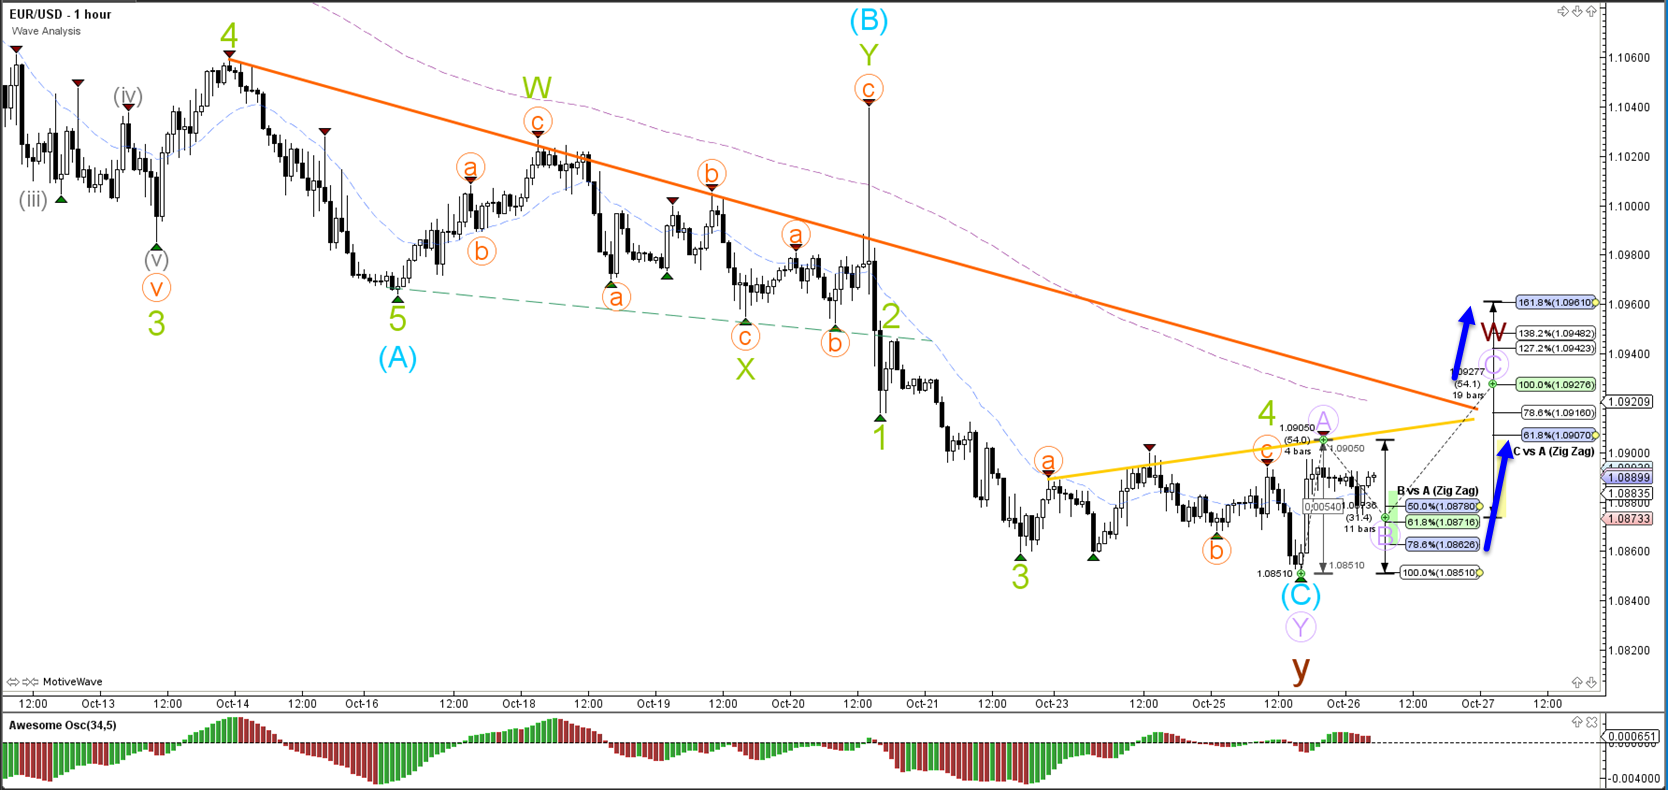
The EUR/USD seems to have completed a wave 4 and 5 within wave C (blue). The bullish momentum has been labelled as a wave A (purple) and the Fibonacci levels could be important if a bullish ABC zigzag (purple) indeed materializes.
GBP/USD
4 hour

The GBP/USD broke the support (dotted green) of the contracting triangle and indeed fell towards the next Fibonacci level of wave X (blue) which was the 78.6% Fib level. For the moment the bearish breakout seems to be part of a larger correction (WXY blue) rather than the restart of the downtrend.
1 hour
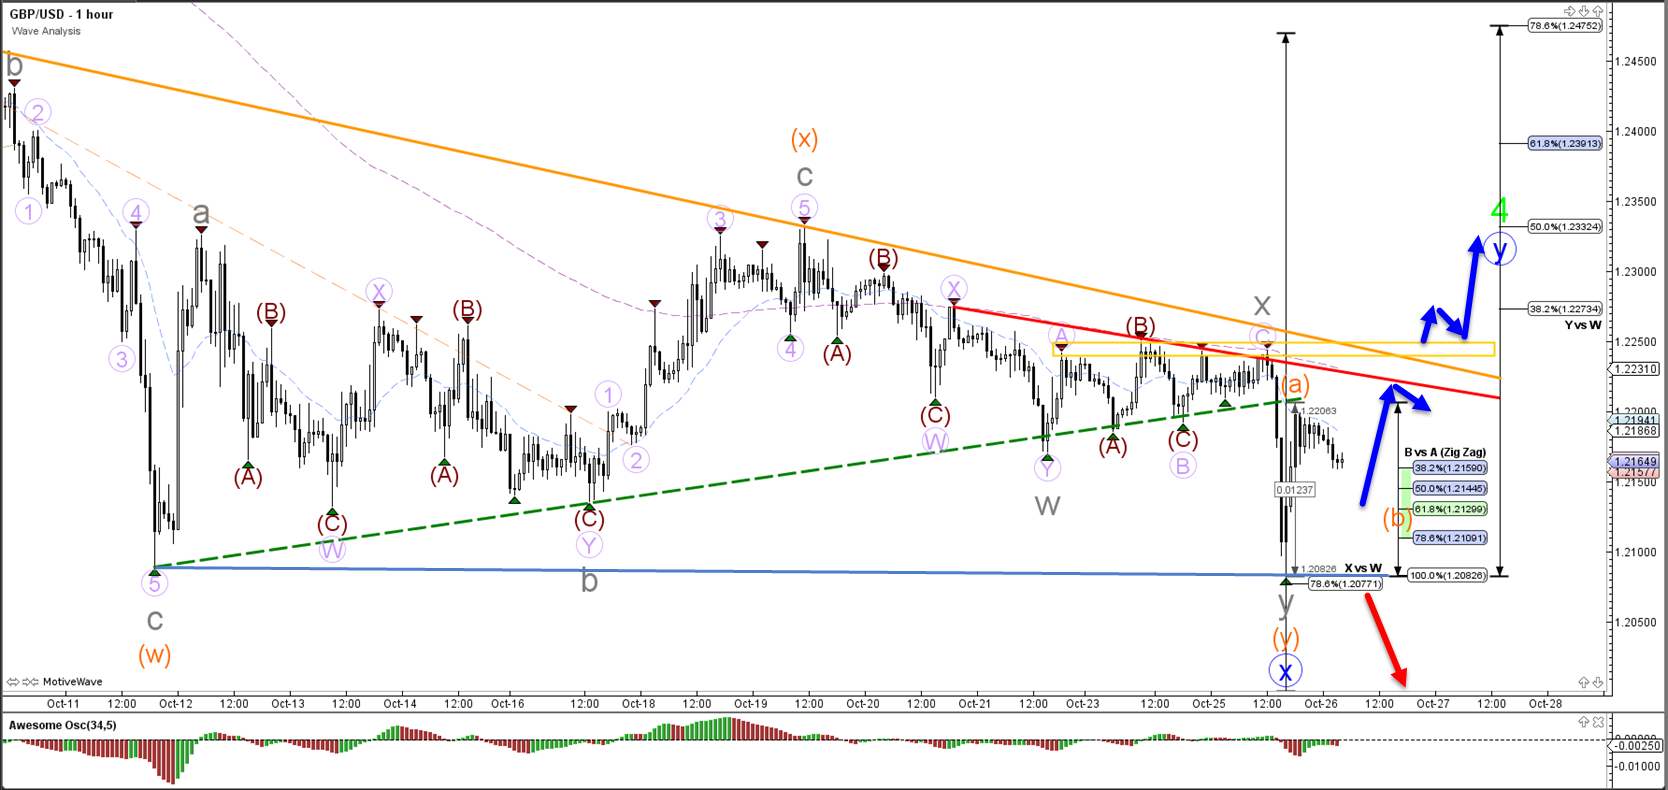
The GBP/USD is also showing the potential for an ABC zigzag (orange). At the moment the bullish momentum has been labelled a wave A (orange). A zigzag is invalidated if price breaks below the bottom of wave A (100% Fib of wave B vs A).
USD/JPY
4 hour

The USD/JPY is attempting to break the sideways correction and daily top (brown) but the breakout has so far been choppy. A deeper correction however will most likely find support within wave 4 (blue) at the 23.6% or 38.2% Fibonacci levels.
1 hour

The USD/JPY could build a bearish ABC (brown) zigzag unless price breaks above the 100% Fibonacci level, which would indicate a potential for uptrend continuation.
Disclosure: None.


