
EUR/USD, GBP/USD Test Support And Resistance Trend Lines
EUR/USD
4 hour

The EUR/USD is building a contracting triangle pattern (orange/green) at the major support levels from the daily chart (green). A bullish break above resistance (orange) could see price correct to higher Fibonacci levels. A break below the support zone (green lines) indicates a continuation of the downtrend.
1 hour

The EUR/USD seems to have completed another ABC zigzag (blue) within a larger WXY (brown/purple) correction. A bullish bounce at the Fibonacci levels could indicate that price will extend the correction in a wave Y (brown).
GBP/USD
4 hour

The GBP/USD has both support (green) and resistance (red) trend lines nearby. The Cable needs to break below the support trend line (green) to confirm a downtrend continuation within waves 5. A breakout above resistance (red) might soon run into new resistance at the Fibonacci levels of wave 2 vs 1.
1 hour
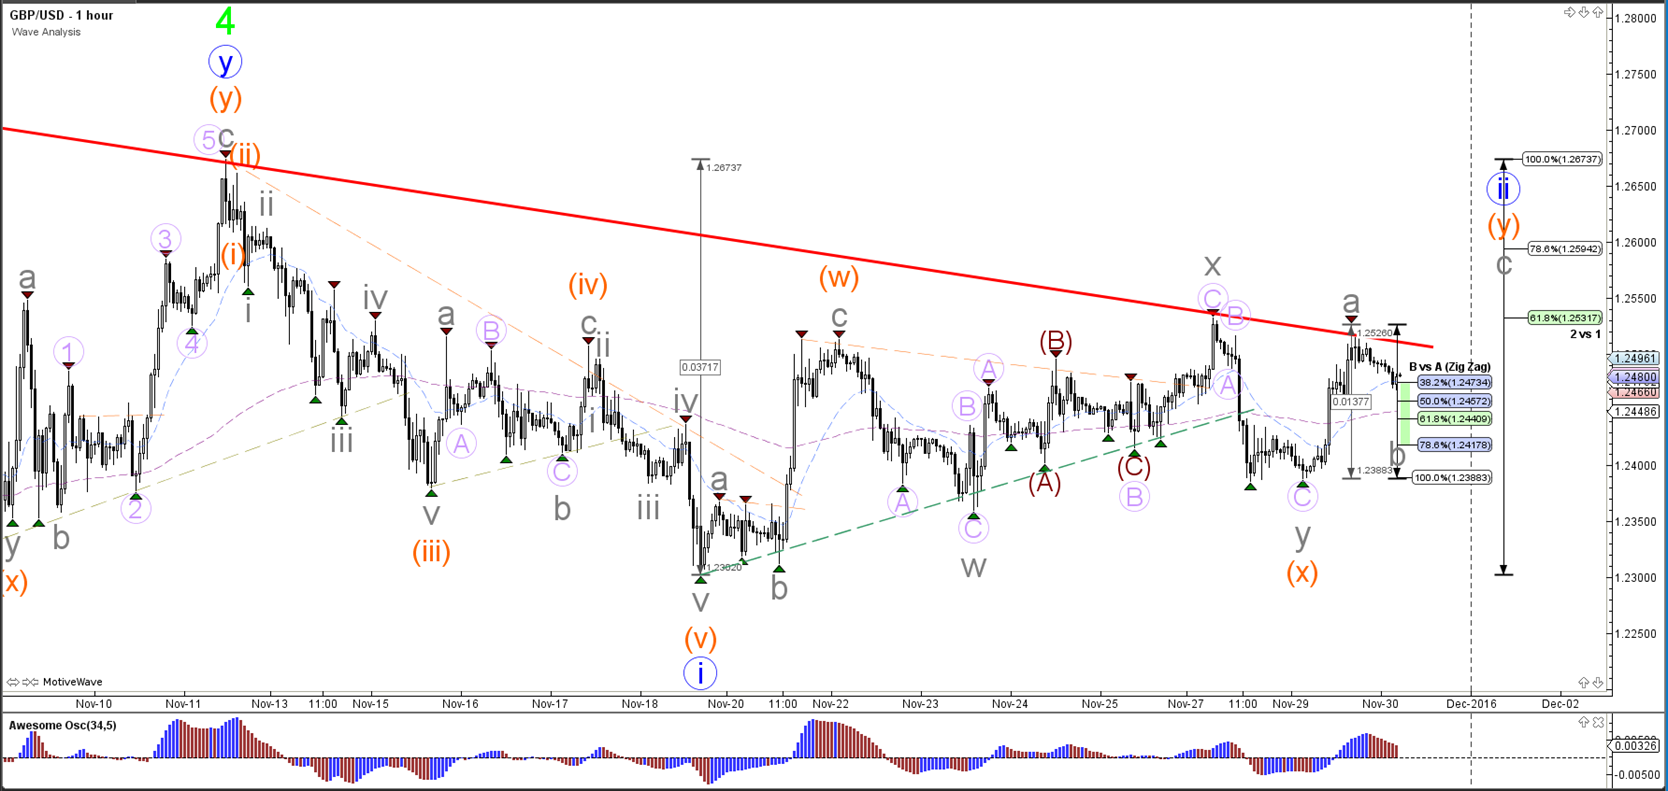
The GBP/USD showed strong bullish momentum which could be part of a larger ABC (grey) zigzag. A break above resistance (red) could see price push to the 78.6% Fib of wave 2 vs 1. A break below the 100% of wave B vs A indicates a bearish breakout zone.
USD/JPY
4 hour

The USD/JPY is building a correction and is retracing within a wave 4 (blue) or is starting already the wave 5 (blue) continuation. The23.6% and 38.2% Fibonacci levels are expected to act as support if price does retrace deeper.
1 hour

The USD/JPY bullish break above resistance (dotted orange) showed strong momentum and has been marked as a wave 1 (brown). Price could now be in a wave 3 (brown) unless price breaks below the 100% level of wave 2 vs 1.
Disclosure: None.


