
Equity Markets In U.S. Doing Fine But Not So In Most Other Areas Of The World - Take A Look
With markets closed today, it’s a good time to provide an update of our country ETF trading range screen that shows where global equity markets stand heading into the final trading week of the year.
Written by BespokePremium.com
In the screen [below]:
- The dot represents where each ETF is currently trading within its range.
- The tail end represents where it was trading one week ago.
- The black vertical “N” line represents each ETF’s 50-day moving average.
- When the price is above the 50-day, the ETF is thought to be in a short-term uptrend.
- A price below the 50-day means it’s in a short-term downtrend.
- Moves into the red or green zones are considered overbought or oversold.
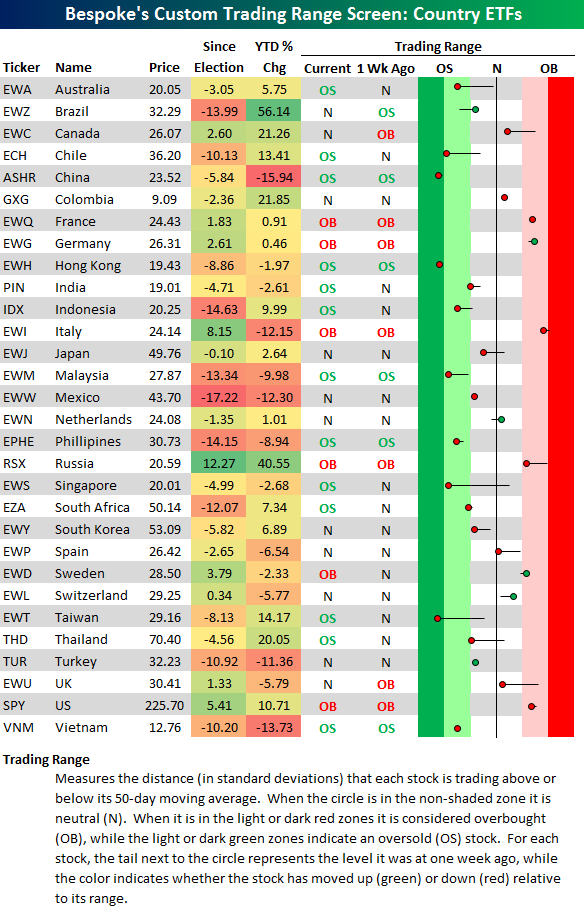
While the U.S. (SPY ) is entering the final week of the year in overbought territory, the number of countries that are oversold is more than double the number that are overbought - and only 12 of the 30 countries in our screen are above their 50-day moving averages - so, while equity markets here in the U.S. have been doing fine, that’s not necessarily the case in other areas of the world.
This article may have been edited ([ ]), abridged (...) and/or reformatted (structure, title/subtitles, font) by the editorial team of munKNEE.com (Your Key to Making Money!) to provide a faster ...
more

