
Emerging Markets In 2018: Value Or Growth?
Emerging markets have been on an incredible performance run in 2017. Can the drivers of these results continue for another year? That’s the question we hear many people asking.
Understanding the Shifting Valuation Landscape
With strong gains, it becomes important to look at the underlying drivers and any changes in valuation that might impact these drivers in the future. While valuation alone may not be the best predictor of an upcoming correction, we’ve found that the more extended the valuations become, the tougher it becomes to generate similarly high future returns.1
- Information Technology—particularly a handful of Chinese Information Technology firms—has gotten a lot of attention in 2017 and has performed strongly. The sector is up 66.3%. In the sector, the Internet and software industry is up 82.9% (this is the industry to which firms such as Tencent, Alibaba and Baidu—up 116.02%, 114.13% and 50.25%, respectively—belong).2
- Energy, on the other hand, has been a rougher experience: It is the third worst performing sector in 2017, returning 18.78%. If people are trying to find single-digit P/E ratios in emerging markets, this sector is not a bad place to look, with more than one-third of the weight of the Energy exposure in the MSCI Emerging Markets Index benchmark having a trailing P/E ratio below 10x.3
The divergence in performance and valuation between the Information Technology sector and the Energy sector in emerging markets gives us a great deal of market context—for one thing, it gives us a starting point to understand why growth-oriented strategies have done so much better than value-oriented strategies in 2017.
Massive Performance Divergence Has Led to Massive Valuation Divergence
(Click on image to enlarge)
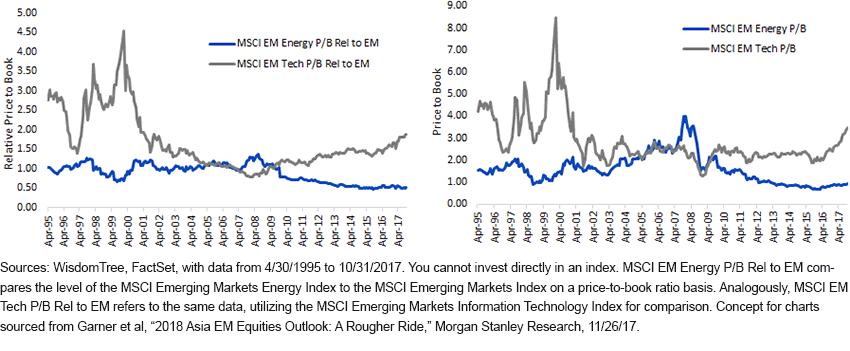
- Energy: The price-to-book value ratio of the MSCI Emerging Markets Energy Sector has reached a level that is equal to approximately half that of the broad Index, trending toward the lowest relative level seen over more than 20 years. We can all step back knowing two things: 1) Yes, the price of a barrel of oil is at a much lower level than what we saw only a few years ago, and 2) there remains a very large demand for petroleum and petroleum-related products. If people are seeking an area of emerging market equities where prices might be too low compared to fundamentals, Energy may not be a bad place to look.
- Information Technology: The price-to-book value ratio of the MSCI Emerging Markets Information Technology—more than 28% of the MSCI Emerging Markets Index as of October 31, 2017—is approaching a level that’s twice that of the broad MSCI Emerging Markets Index. In and of itself, this does not mean a correction is necessarily imminent, and we can see from the charts above that this is nowhere near the levels seen in 2000, what we now know of as the “Information Technology bubble.” But what it does mean is that if these firms cannot continue to outperform the growth that investors expect, they could be at risk of lower future returns.
To Mean Revert or Not to Mean Revert?
While the definitive answer to that question is impossible to know today, the viewpoint that investors choose to take will tell them a lot about the strategy they might want to look at for emerging market equities.
Information Technology vs. Energy Exposure in Emerging Market Equity Indexes
(Click on image to enlarge)
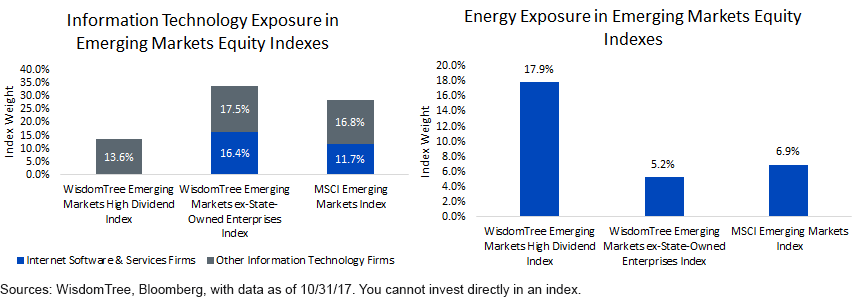
- High Dividends as the “Value” or “Contrarian” Strategy: Information Technology is a large under-weight here, and it’s notable that there was no exposure to the Internet software and services firms that have been leading the market higher. On the other hand, the Energy sector exposure is more than twice that of the broad benchmark. This has been the quintessential emerging markets value strategy, live for more than 10 years. In 2017, it has underperformed the broad benchmark by about 15%, but that followed a year that it outperformed by more than 12% during a big Energy sector rally in emerging markets.4
- Ex-State-Owned Enterprises as the “Growth” or “Momentum” Strategy: Approximately one-third of the exposure of this Index is in Information Technology, with about half of that coming from Internet software and services firms. In 2017, it is up almost 46% through November 27, which compares to a market return closer to 35%.It only has about a 5% exposure to Energy—a sector in which many of the biggest firms would be more than 20% owned by emerging market governments and therefore ineligible for inclusion.5
Thoughts for 2018 and Beyond
As we look to the future, while we can’t ascertain performance ahead of time, we can help with context on different ways to look at and invest in emerging market equities. The WisdomTree Emerging Markets ex-State-Owned Enterprises Index by design mitigates exposure to governments and largely tilts toward the new economy sectors that we believe will drive future growth in emerging markets. That being said, if people are worried about valuations becoming extended and desire more defensive positioning or a contrarian view, the WisdomTree Emerging Markets High Dividend Index may be better positioned.
1Sources for bullets, unless cited differently: WisdomTree, Bloomberg, with data from 12/31/16 to 11/27/17.
2Tencent (4.29% weight), Alibaba (3.28% weight) and Baidu (1.17% weight) were the three largest exposures over the course of 2017 in the MSCI Emerging Markets Index from the Internet software and services industry.
3Refers to the weight of the firms in the MSCI Emerging Markets Index Energy sector with trailing P/E ratios below 10.0x divided by the total weight of all Energy firms in this Index. Data is as of 10/31/17 due to licensing restrictions.
4Sources: WisdomTree, Bloomberg. 2016 calendar year performance refers to 12/31/15 to 12/31/16. 2017 Year-to-date performance refers to 12/31/16 to 11/27/17 performance.
5Sources: WisdomTree, Bloomberg.
Disclaimer: Investors should carefully consider the investment objectives, risks, charges and expenses of the Funds before investing. U.S. investors only: To obtain a prospectus containing this ...
more

