
Crude Oil Prices Show Early Topping Signs Near 4-Month Highs
Crude oil prices recovered from intraday losses after Russian Energy Minister Alexander Novak said his country is working out the mechanism for coordinating output strategy with OPEC and non-OPEC producers after a meeting with cartel officials in Vienna. A firming US Dollar applied de-facto pressure on prices on earlier in the day.
An OPEC technical committee meeting at the end of this month will pave the way for formal talks on production cut quotas at the end of November, following on from an agreement to cut output struck at an informal meeting in September. Russia will reportedly decide if it will join the price-boosting effort following next month’s gathering.
On-going negotiations may continue to be a source of headline-inspired volatility in the day ahead as OPEC Secretary-General Mohammed Barkindo travels to Iraq to discuss production levels. The weekly set of inventory flow figures from API is also due to cross the wires. Official DOE figures to be reported on the following day are expected to show a build of 557.38k barrels.
Gold prices were little-changed yesterday. A brief attempt at building upside momentum was thwarted and gains erased as the greenback rose alongside Treasury bond yields, undermining demand for anti-fiat and non-interest-bearing assets. October’s US Consumer Confidence report and scheduled comments fromAtlanta Fed President Lockhart are in focus as Fed rate hike speculation continues to evolve.
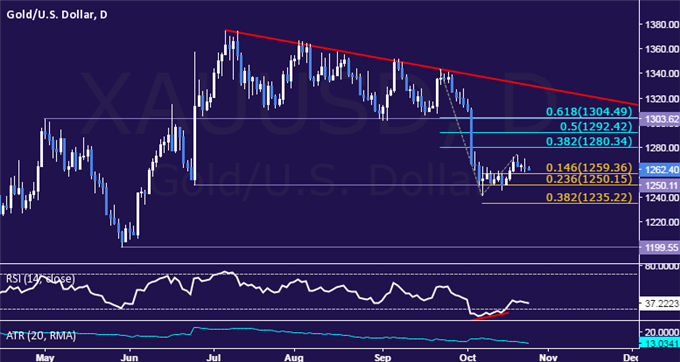
GOLD TECHNICAL ANALYSIS – Gold prices corrected higher as expected after starting October with a slide to a four-month low. From here, a daily close above the 38.2% Fibonacci retracement at 1280.34 exposes the 50% level at 1292.42. Alternatively, a move below the 14.6% Fib expansion at 1259.36 targets the 1250.11-15 zone (23.6% expansion, June 24 low).
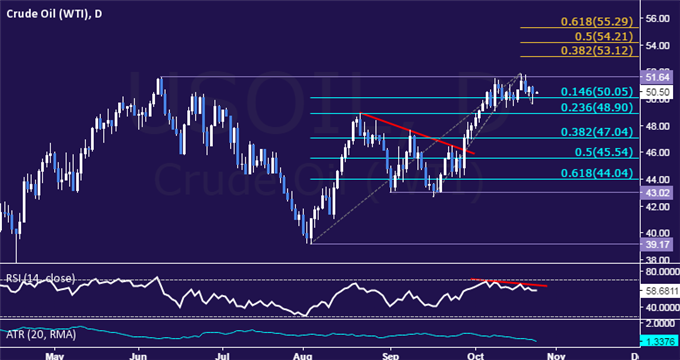
CRUDE OIL TECHNICAL ANALYSIS – Crude oil prices probed above key resistance at June’s swing high (51.64) but failed to secure a lasting breakout, with negative RSI divergence warning that a reversal lower may be ahead. A daily close below the 14.6% Fibonacci retracement at 50.05 exposes the 23.6% level at 48.90. Alternatively, a breach of 51.64 sees the next upside barrier at 53.12, the 38.2% Fib expansion.
Continue tracking these setups and more throughout the week- Subscribe to more


