
Wide Moat ETF Offers An Interesting Conglomeration Of Stocks
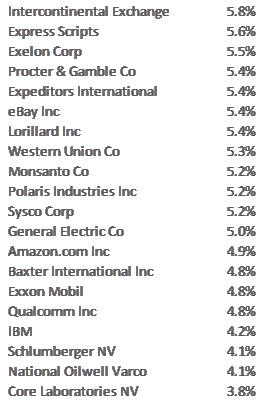
Morningstar Wide Moat Total Return ETF (MOAT) offers an interesting conglomeration of stocks. All the companies have one common attribute – a high barrier to entry for competitors and an undervalued stock price. MOAT offers exposure to the top 20 companies identified by Morningstar as having a “wide moat”. Below is the current list of stocks:
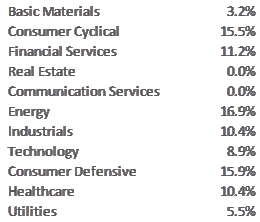
80% of assets are large cap stocks and 20% are mid-caps. 40% are considered Value, 49% considered Growth and the balance 11% a Blend. Sector allocations of these holdings are:
MOAT offers a 1.2% yield and charges a 0.45% fee.
While the underlying Index has been around since 2007, the ETF was established in early 2012 and MOAT has about mirrored the S&P 500 return. Van Gleck ETF database offers this review:
Moat = Sustainable Competitive Advantage
Morningstar equity analysts use a time-tested proprietary process to determine if a company has an economic moat. The Index Favors Undervalued Stocks. Of the broad equity universe analyzed by Morningstar, currently about 10% receive a wide moat categorization; the 20 stocks with the most attractive valuations are selected for its Index. Proven Index Track Record. Index has generated significant excess returns relative to the overall market since inception in 2/07.
According to Morningstar,
“only companies with an economic moat — a structural competitive advantage that allows a firm to earn above-average returns on capital over a long period of time — are able to hold competitors at bay.”
In addition to offering a wide moat, the Index identifies the most undervalued of these companies and incorporated the top 20 most undervalued stocks.
An informative article written by Morningstar concerning their Wide Moat Index can be found here.
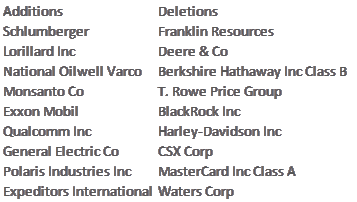
Morningstar adjusts the Index portfolio once a quarter to reflect new names that are upgraded and deletions to Wide Moat Index status. Most of the deletions are triggered by better value elsewhere. The latest adjustments are below:
From its founding in 2007 to the bottom of the market crash in 2009, the Index mirrored the S&P 500 return. However, since 2009, the Index has substantially outperformed the S&P, as shown in the graph below:
The blue line is the performance of the Wide Moat Index and the red line is the SPX.
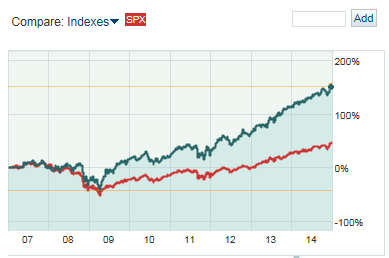
Source: marketwatch.com
From the graph, long-term investors in the Index would have generated substantially greater returns than the market.
MOAT is an easy method of gaining portfolio exposure to both the specific companies and to the investing philosophy of Morningstar. Long-term investors should review MOAT as a core holding.
Disclosure: No positions


