
Why Risk Parity Could Boost Energy Stocks
Risk Parity is a portfolio construction technique that seeks to allocate capital so as to maintain similar levels of risk from each asset. Some commentators are blaming it for the recent market turmoil, since superficially its practitioners are expected to reduce risk when it rises. That can often mean selling stocks. AQR is among the asset managers who employ this approach. In 2010 they published a paper explaining the theory, noting that traditional portfolios typically derive a larger proportion of their risk from equities than is implied by simply looking at percentage allocations.
A 60:40 stocks/bonds portfolio will incur more than 60% of its risk from stocks, because they move more than bonds. Risk Parity seeks to compensate for this, and the paper showed improved returns over a passive 60:40 approach. The paper goes on to describe a portfolio with less equity exposure than a traditional 60:40 portfolio and correspondingly less risk. Because it has a higher Sharpe Ratio (i.e. better risk/return) but lower return, leverage is then employed to raise the risk to the same as 60:40, at which point the return should be higher.
Since allocations under a Risk Parity regime target a given level of risk, changes in risk estimates will lead to a shift in allocations, and may also require changes to leverage. One popular measure of risk is volatility. For simplicity, we’ve defined it as the average percentage daily move over the prior ten days. Although Risk Parity is typically applied to asset classes, the concept can also be applied to sectors within an asset class. A strategy of achieving Risk Parity among asset classes can also be designed to achieve Risk Parity across sectors within an asset class.
In response to criticism that funds employing Risk Parity are behind the recent sharp moves, some managers of such funds have responded that such shifts are slow – their models are designed to recalibrate over longer periods than just a few days. It’s impossible to know the extent to which the critics are right — on Friday JPMorgan estimated that most of the “severe” unwind was over. However, we’ve noticed another shift, which is that risk in the energy sector is falling relative to the S&P 500. This is partly due to correlations increasing, as they do during market dislocations. Sector differentiation becomes less important than overall market exposure, and sectors move up and down together. For example, the S&P Low Volatility Index is down 6.5% for the month, almost as much as the S&P 500 itself (down 7.2%), even though Low Vol should be, well, less volatile.
Nonetheless, Risk Parity strategies that are deployed at the sector level could eventually increase energy exposure at the expense of other sectors whose relative volatility against the S&P 500 has increased.
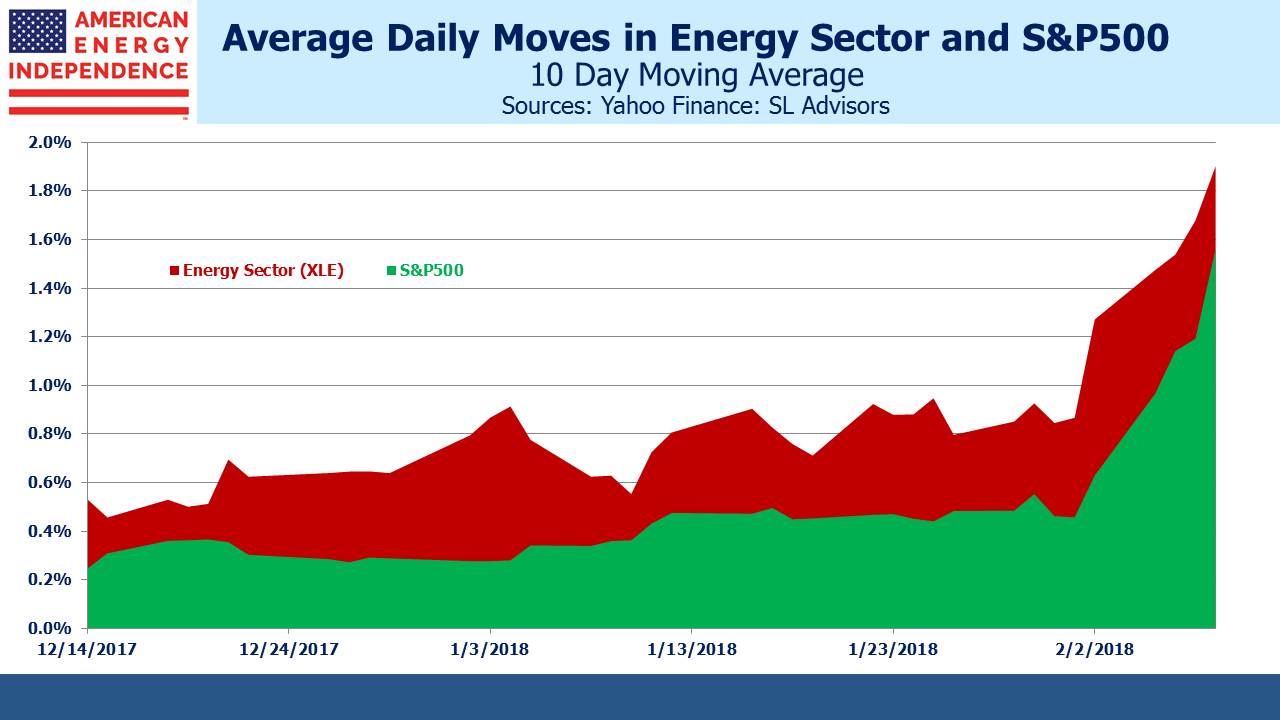
It can seem an arcane topic. But put simply, in a time of heightened volatility, the Energy sector is gyrating with the rest of the market whereas it was previously moving sometimes twice as much. The first chart compares XLE with SPY, where although average daily moves have increased in both cases, SPY moves have jumped by 150% while XLE moves have “only” doubled.
Many reliable trends have abruptly shifted, including persistent low volatility. The spectacular collapse of the Credit Suisse note (XIV) following the spike in volatility was extraordinary. Why would people hold a product that seems destined to eventually blow up?
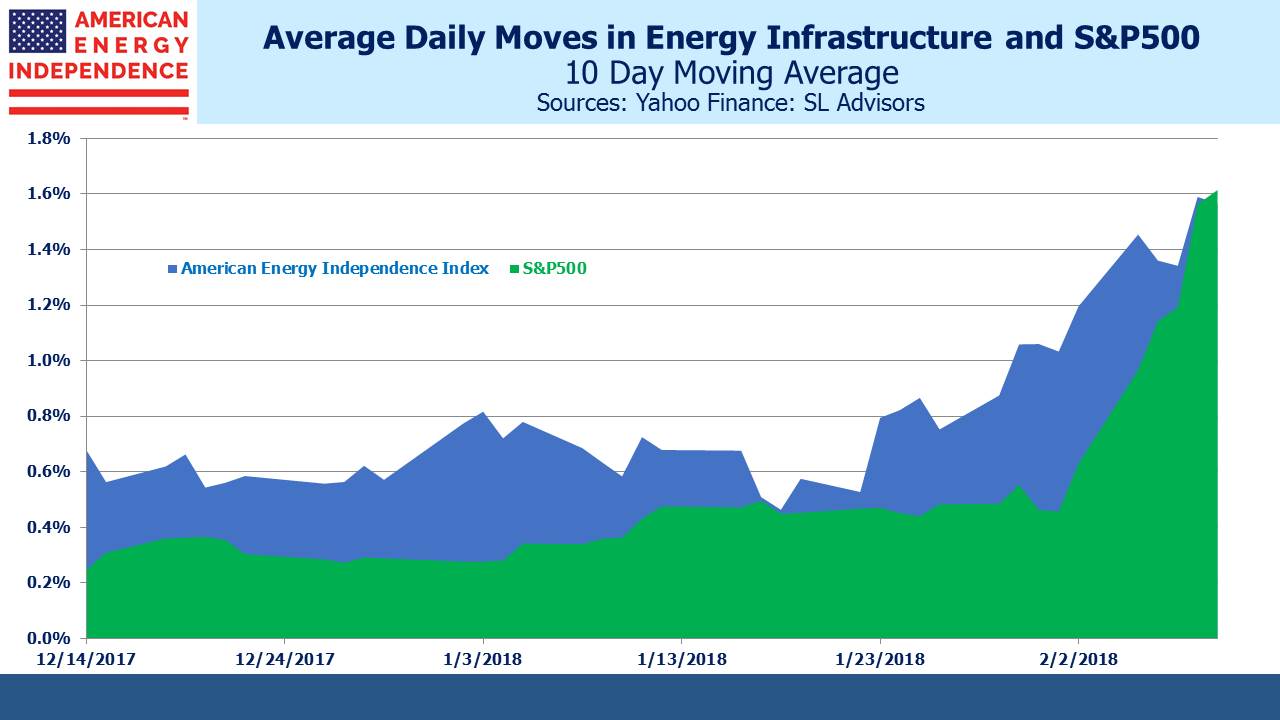
The difference in volatility is more dramatic when comparing Energy Infrastructure (defined here by the American Energy Independence Index) with the S&P 500. Their average daily moves are roughly the same. Until recently, energy infrastructure (including MLPs) was moving twice as much as the broader market. Domestic, midstream assets that support U.S. energy independence have experienced a comparatively modest increase in volatility compared to the overall market. Daily moves in the S&P 500 and energy infrastructure are converging. At a time of increased uncertainty, if investors begin to value the more reliable cashflows these companies generate, further buying of the sector will follow.
The American Energy Independence Index (AEITR) finished the week -4.2%, outperforming the S&P500 which was -5.2%.
Disclosure
: None.


