
What’s Wrong With Energy Sector Funds?

Photo credit: mwwile (Flickr)
Check out this week’s Danger Zone interview with Chuck Jaffe of Money Life and MarketWatch.com.
This week, we’re putting Energy sector ETFs and mutual funds in the Danger Zone. While energy prices look to have bottomed out at this point and it may be tempting to bet on a broad turnaround in the sector, the funds in the Energy sector simply do not provide compelling investments. This point rings especially true when considering the number of good stocks in the sector.
The Energy sector ranks dead last out of all 10 sectors in our most recent 2Q15 sector ratings report. This is because 67% of Energy ETFs and mutual funds earn our Dangerous or Very Dangerous ratings.
What’s Driving Poor Ratings in the Energy Sector?
The main driver of the Energy sector’s last place ranking this quarter is the poor quality of the holdings in Energy sector funds.
Figure 1 shows how the Energy sector looks through the lens of our Portfolio Management rating. No funds get an Attractive or Very Attractive Portfolio Management rating, and just four funds in the entire Energy sector hold enough good stocks to earn our Neutral Portfolio Management rating. The remaining 96% of ETFs and mutual funds are Dangerous or Very Dangerous when it comes to our Portfolio Management rating.
Figure 1: Poor Portfolio Ratings in the Energy Sector
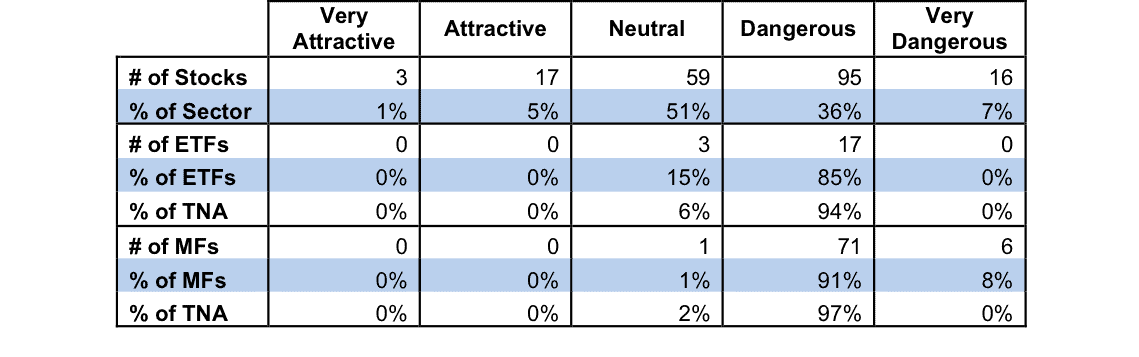
Source: New Constructs, LLC
The most troubling aspect of these poor Portfolio Management ratings is that 42% of the stocks (57% of the market value) in the Energy sector get Neutral or better ratings. While there isn’t an overwhelming number of good stocks in the Energy sector, there are plenty with which to construct a good portfolio. Sources: New Constructs, LLC and company filings.
What’s Even Worse? Misleading Costs
To make matters worse, the Energy sector is the worst offender when it comes to misleading costs for its funds. The average difference between the stated expense ratios of Energy funds and the actual total annual costs is an overage of 0.74%, with the total annual costs of some Energy funds exceeding their expense ratios by 292 basis points. This average is more than that of any other sector.
While a 0.74 percentage point discrepancy doesn’t seem like much at first, note that over a 10-year period, this discrepancy compounds to an additional 8% of your investment being eaten up by fees. And that’s just the average — if you were to stumble into one of those funds with a 292 basis point discrepancy, that additional 2.92% in annual costs would cost you over a third of your returns over 10 years. This is an example of why you need to be aware of all of the costs of being in a given fund, especially in the Energy sector where the problem of hidden costs is worse than in any other sector.
Overall, Not a Pretty Picture
When it comes to overall rating, which combines our Portfolio Management and total annual cost ratings from above, there are only three Attractive- or Very-Attractive-rated funds overall in the entire Energy sector. These funds each have energy service-focused portfolios, which means they are less dependent on swings in energy prices. They are:
- Fidelity Select Energy Service Portfolio (FSESX): receives our Very Attractive rating and has total annual costs of 0.96% — well below the average for all mutual funds of 1.87%.
- Van Eck Market Vectors Oil Services ETF (OIH): gets our Attractive rating with total annual costs of 0.39% –– well below the average for sector ETFs of 0.53%.
- iShares Dow Jones U.S. Oil Equipment and Services Index Fund (IEZ): gets our Attractive rating and has total annual costs of 0.50%.
Some of our favorites stocks in this sector are Cameron International (CAM), National Oilwell Varco (NOV), Dril-Quip (DRQ) and Halliburton (HAL), all of which are oil services companies and all of which find their ways into the top five holdings of the funds listed above. We think that these companies’ stocks have been hit a little too hard following the decline in energy prices, and that the underlying strength of their business models makes them good bets for the long term.
What’s the problem with most stocks in this sector? It looks to be two-pronged: Overvaluation and low profitability. Despite the weighted average return on invested capital (ROIC) in the sector being only 6%, the weighted average positive price to economic book value (PEBV) ratio is 2.9, which implies close to a tripling of profits in the sector going forward (this doesn’t take into account all 58 companies in this sector with negative PEBV ratios, most of which are also highly overvalued). These two numbers indicate that despite the low profitability in this sector, speculation in this sector regarding expectations for rising energy prices is beginning to take hold and is driving up valuations.
Some Good Stocks, Mostly Bad Stocks
Investors need to be careful in this sector. Even big funds with big names can lure you into a trap.
Take State Street SPDR S&P Oil & Gas Exploration & Production ETF (XOP) for example. With over $1.8 billion in assets under management, XOP is one of the largest funds in Energy sector and it has low total annual costs of 0.39%. However, it still receives our Very Dangerous rating due to its poor holdings, which include companies like Newfield Exploration Co. (NFX). We talked a bit about how we like oil services companies earlier in this report, but the other side of the coin are oil and gas exploration companies like Newfield.
While Newfield is up 46% this year, investors have probably been using the company’s misleading 2014 GAAP net income of $900 million, which would represent a 700% increase from 2013’s income. After looking more closely at the filing, we removed $457 million in non-operating income and $250 million in after-tax non-operating income from discontinued operations, among other things, to reveal Newfield’s core operating profit (NOPAT) of just $364 million.
Although NFX is down overall since the decline in energy prices started, the stock is still very overvalued at $39/share. While the company grew revenues by 28% in 2014 and after-tax profits by 40%, the company still earns a ROIC of just 3%. In addition, like many exploration companies, Newfield is highly leveraged with over $3 billion in total debt. On top of this debt, Newfield has $1.6 billion in deferred taxes that it owes, which we also take into account when considering the company’s valuation.
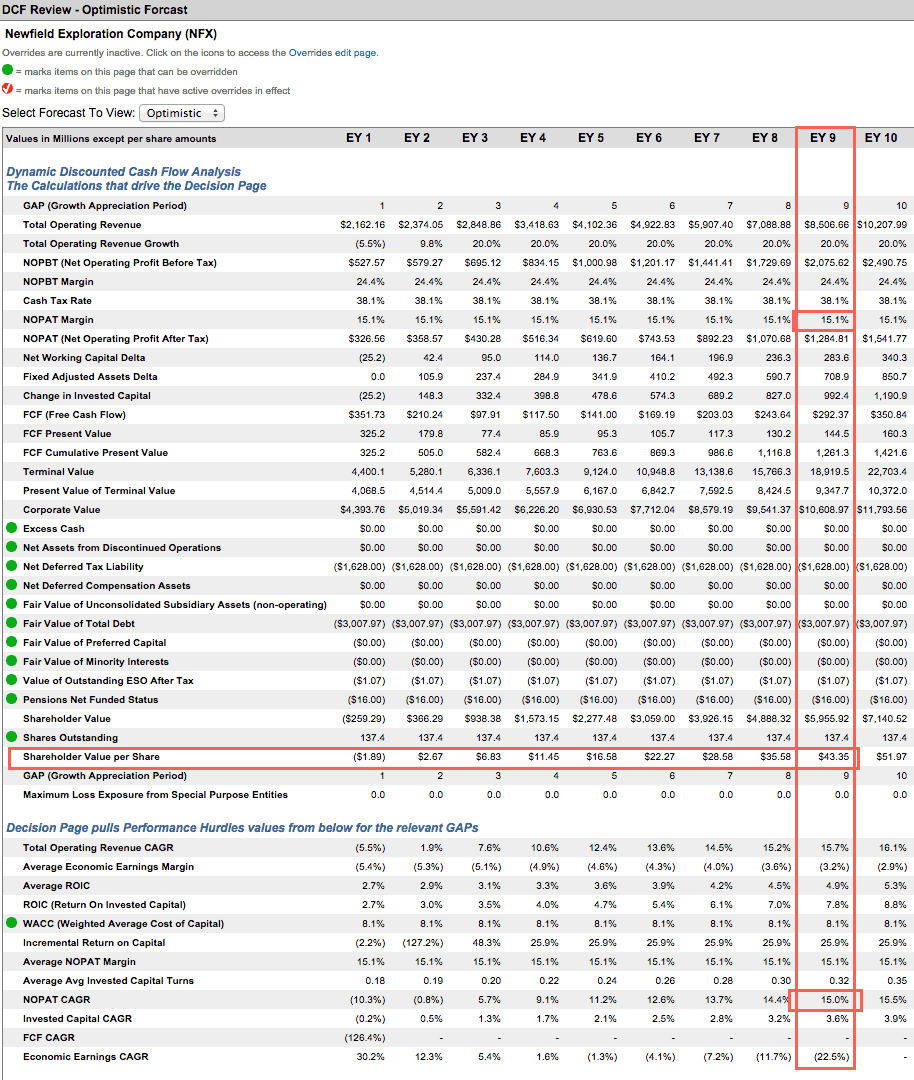
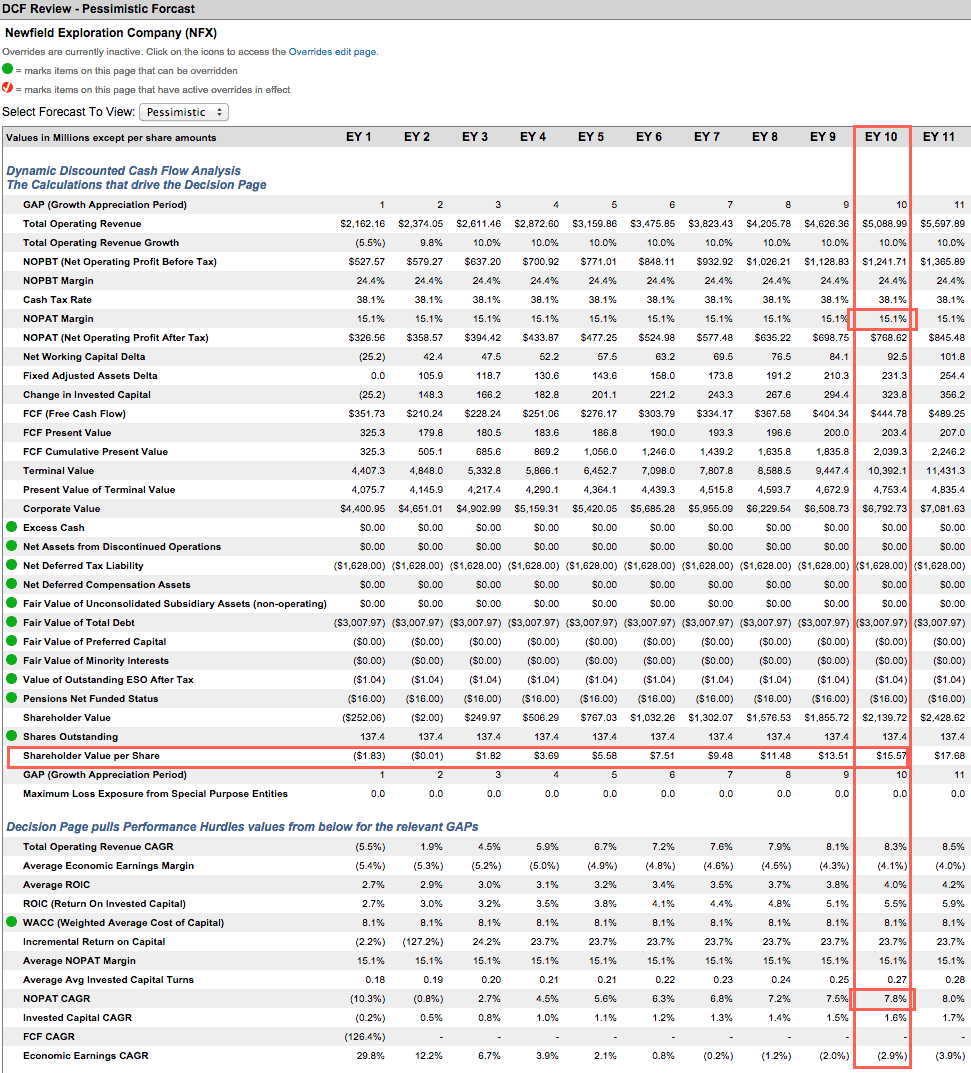
To justify its current valuation of $39/share, Newfield must grow NOPAT by 15% compounded annually for the next 9 years. If Newfield can grow profits instead by 8% compounded annually for the next 10 years (still above its 14-year NOPAT CAGR of 7%), the stock is worth only $16/share, a 59% downside.
Investors should be careful betting on the energy price turnaround with companies like Newfield — the potential for downside is ugly, to say the least. Energy sector funds are full of companies like Newfield that have seen their prices driven up by speculation.
Disclosure: New Constructs staff receive no compensation to write about any specific stock, sector, or theme.


