
The Market Trend Remains Bullish, Any Near-Term Pullback Should Be Contained
We've had a big 10% gain in the S&P 500 ETF (SPY) since Donald Trump shocked the world and won the U.S. Presidential election. The market is on pace for a 35% annualized gain since November 9th.
This may cause you some concern: Are we overextended to the upside here, is a big pullback imminent?
My answer to that at this time is, don't panic and sell all your stocks. In fact, the charts (which show price action and buying pressure) remain overwhelmingly bullish.
While a 35% gain might be a bit of a reach, there are several historical precedents for large market gains over the past 20 years:
2013 -- S&P 500 gained 32%
2009 -- up 26%
2003 -- up 29%
1999 -- up 21%
1998 -- up 29%
1997 -- up 33%
Is the broad market potentially a bit over-extended here, could we pull back a bit? Yes.
But based on the recent price action, I would anticipate any pullback to be contained at around a 1.7% loss or so.
Take a look at the SPY Daily Chart below. This contains the indicators that I utilize for trading ETFs and options on ETFs in our Wyatt Research ETF Sector Alerts premium service.
SPY Daily Chart
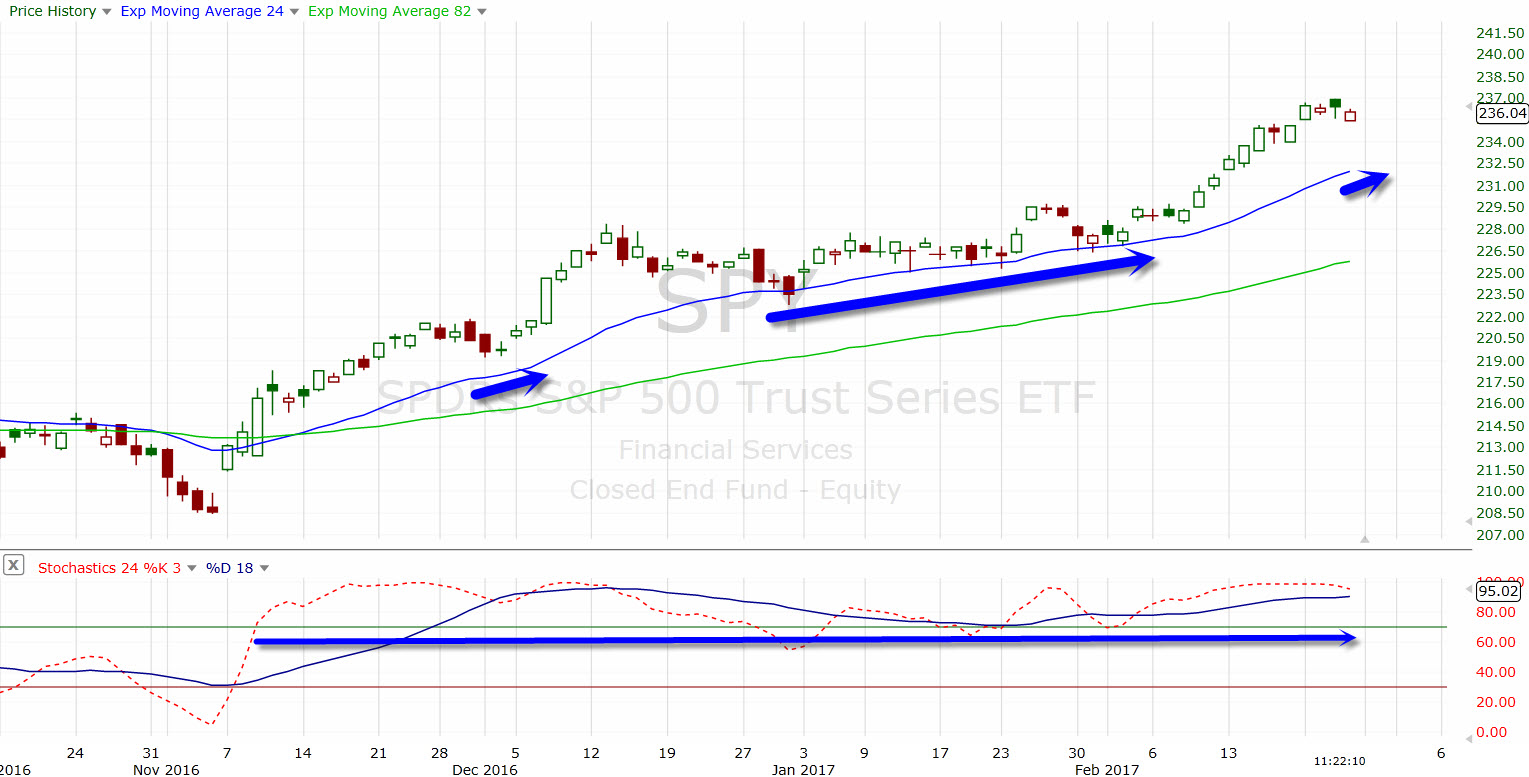
You can see that we have been on a strong run higher since November, with periods of acceleration and healthy consolidation. The 24-day Exponential Moving Average (Exp MA), blue line, has contained pullbacks.
This is an indicator that shows the average price of a security over a certain time frame, with more emphasis on the recent price action. Trending above this line and holding above it on downmoves shows a bullish trend.
This faster Exp MA is currently at 231.92, which is 1.7% under current levels. If we do pull back from here, the 232 area on the SPYders looks an excellent entry point for getting long.
At the bottom of this chart is a Stochastics indicator, an oscillator that shows strength of trend -- this also has optimized, unique input settings on it. An 'overbought' stock that is trending higher is actually in a bullish mode, by my method -- in a strong trend, a security can remain overbought much longer and go much higher than one would normally think. Stochastics has been giving a steadily bullish reading since November.
The bottom line is the trend is your friend and an object in motion is likely to stay in motion -- until the market trend breaks down and/or reverses, we are likely to continue higher, with some limited pullbacks and periods of healthy, sideways trading range consolidation.
Disclosure: None.


Thanks for sharing