The FAANGs: What I'm Watching
Together, the 5 FAANG stocks + 5 tech stocks make up FNGU (an exchange-traded note that tracks 3x the daily price movements of an index of US-listed technology and consumer discretionary companies...the index is highly concentrated and equally weighted).
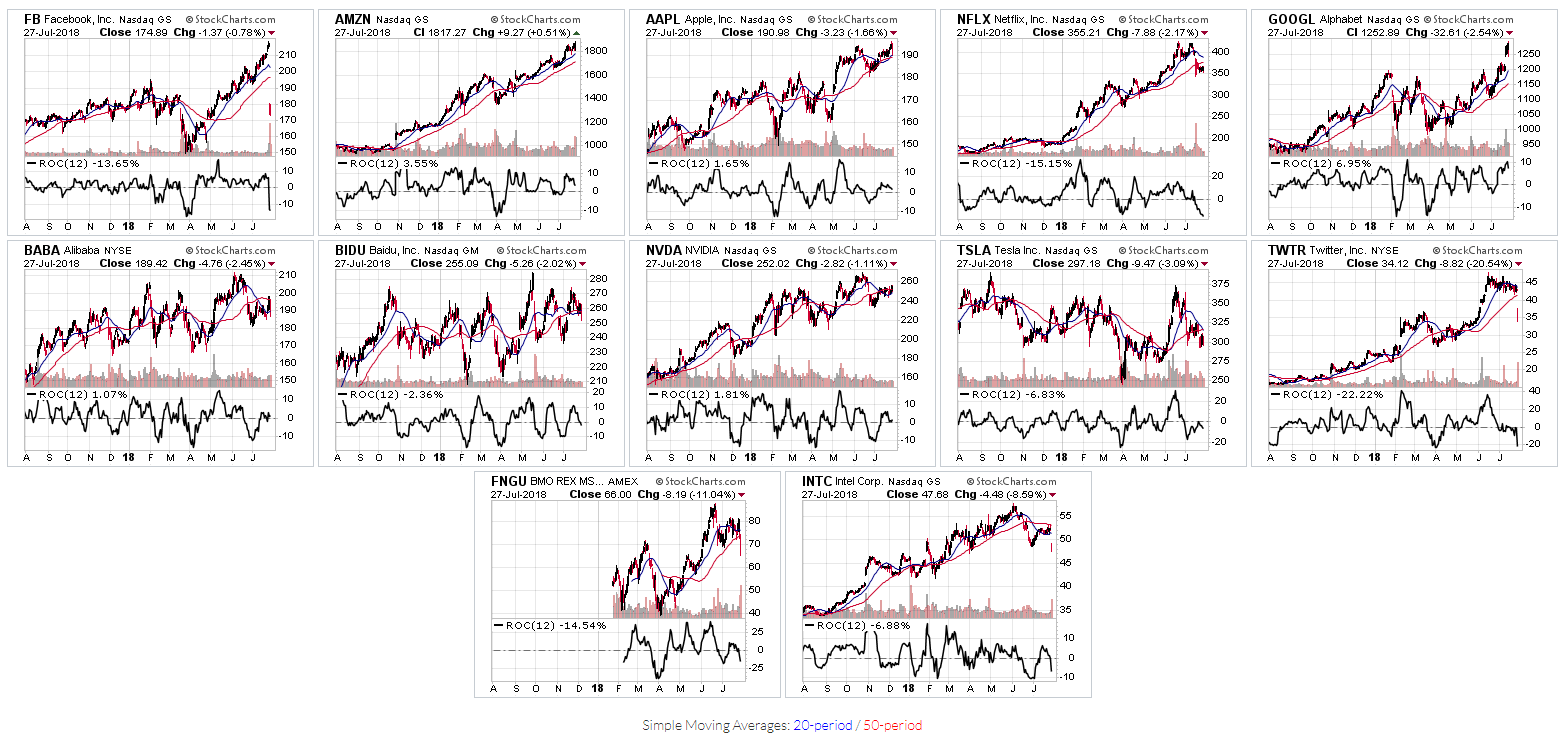
The following 1-year and 2-month daily charts of these 10 stocks, FNGU, plus INTC, show price action relative to their 20 and 50-day MAs, as well as the Rate-of-change (ROC) technical indicator.
Ten out of twelve of them have broken their uptrends, some more recent than others, while others have been mired in sideways consolidation zones for months. "Shock drops," together with high volumes and accelerating ROC, occurred last week on FB, TWTR, INTC and FNGU, while NFLX experienced those on July 17 and is attempting to stabilize.
(Click on image to enlarge)
(Click on image to enlarge)

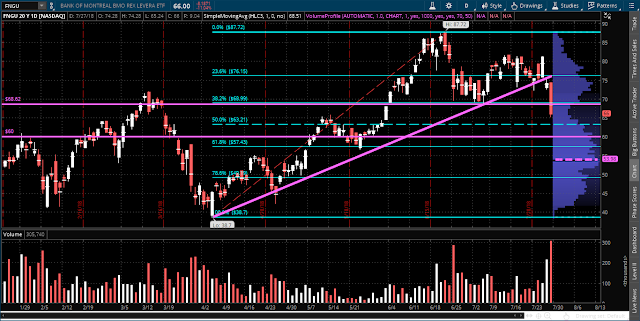
The following daily chart of FNGU shows that price has dropped below the 40% Fib retracement level (69.00) and has broken its uptrend. Price closed last Friday at a low-volume level of the Volume Profile depicted along the right-hand side of the chart.
Near-term resistance lies between 68.62 and 69.00, while first support sits at 50% Fib retracement of 63.21, followed by price support at 60.00. The Volume Profile POC (point of control) sits well below at 53.98.
Over the next few days/weeks, I'll be watching to see if FNGU, either breaks and holds above resistance at 69.00, or whether it continues to drop to the above-noted support levels, or lower. Accelerating volumes and ROC in either direction may provide clues for longer-term sustainability of trend...not only for FNGU but, potentially, also for the eleven tech stocks mentioned above.