
The Best ETF To Profit From Gold
An old saying, paraphrased, is 'those who sell pickaxes during a gold rush will get rich'.
Currently, this axiom applies to gold and silver mining companies.
We've seen a big rally in Gold (GLD), Silver (SLV) and other precious metals ETFs since December.
The potential reasons for this move are myriad: among them are global uncertainty from the new Trump administration, China and India currency and political fluctuations, and U.S. Dollar and interest rate expectations.
But the bottom line is that money is flowing into precious metals and the price action is strong.
It looks like a classic 'flight to safety', that should have some legs.
What is the best way to profit from further moves in the yellow and silver metals?
The gold and silver miners are the outperformers and achieving the best gains -- these companies are leveraged to gains in the underlying commodities.
And the best way to play this group is through a basket of stocks in an ETF, in my analysis. This lessens the overall volatility and risk compared to an individual company.
My favorite ETF among this group is not widely known... yet.
It is PureFunds ISE Junior Silver ETF (SILJ).
SILJ holds a basket of small-cap silver mining and exploration companies. The ETF has holdings in 25 stocks currently, with the top 3 holdings representing about 41% of its total assets. Those largest holdings are in Pan American Silver (PAAS), Coeur Mining (CDE) and First Majestic Silver (AG)
This ETF simply gives the biggest bang-for-the-buck on rallies in the precious metals.
I looked at relative performance over multiple recent time frames: since the December bottom in gold, year-to-date and since the S&P 500 peaked recently on January 26.
SILJ is outperforming GLD, SLV, Gold Miners ETF (GDX), Junior Gold Miners ETF (GDXJ) and Silver Miners ETF (SIL) over all of these time periods.
And in my analysis, SILJ can achieve potential further gains of 30%+ this year, or even sooner.
Take a look at the SILJ Daily chart below.
This chart contains the unique, tested indicators and settings that I utilize for trading sectors in our Wyatt Research ETF Sector Alerts premium service. Those are 24 and 82 day Exponential Moving Averages (Exp MA), which show the average price level over a certain time frame (these are useful to show directional trends and support/resistance levels), and Stochastics, which is an oscillator I use to measure the strength of the price action.
SILJ Daily Chart
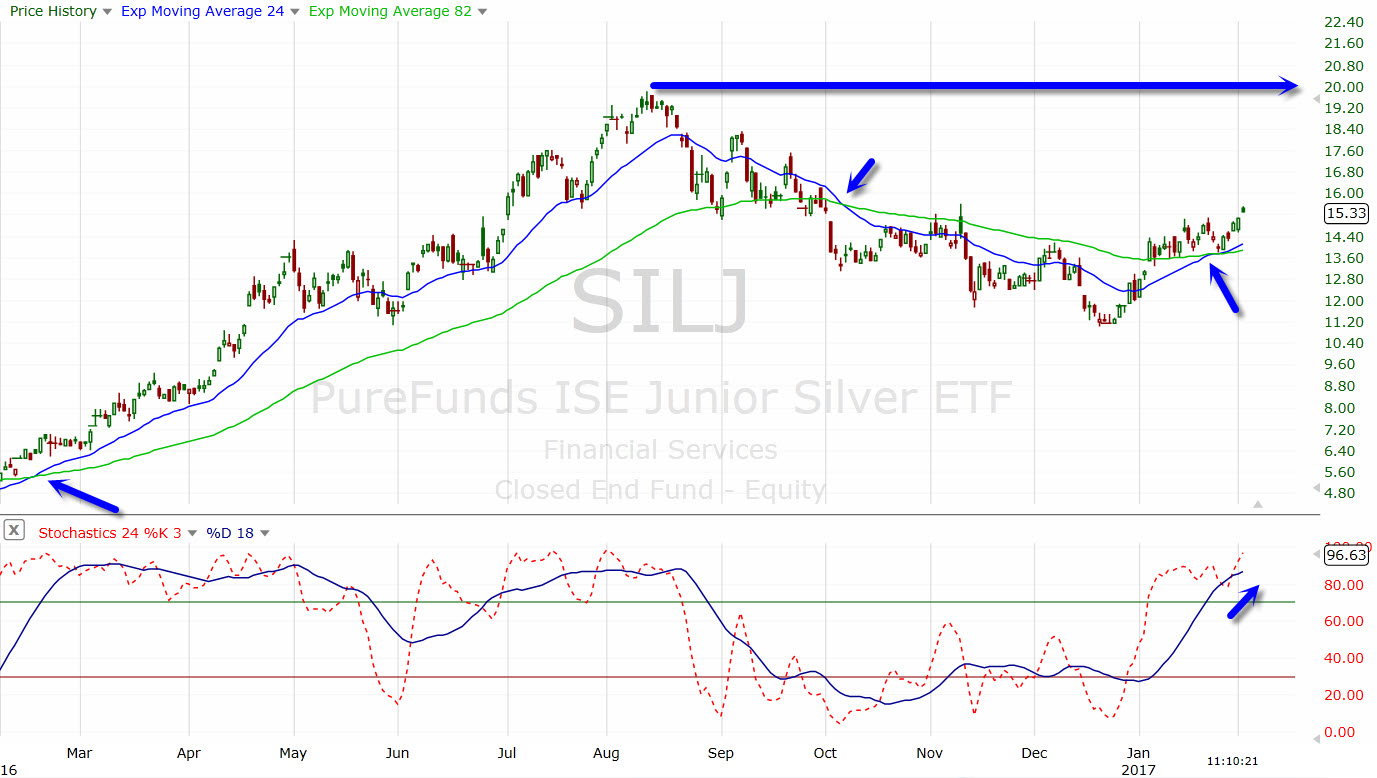
You can see above the SILJ recently had a bullish crossover of the faster moving average above the slower one. The two previous crossovers of these key Exp MAs were good directional triggers in both directions. Notice that SILJ is now trending along and holding support from its faster Exp MA on any pullbacks -- this is a sign of strength and bullish price action. At the bottom of this chart, you can see that both the faster and slower Stochastics is also giving a strong reading above the 70 bullish threshold.
My current upside target on SILJ from here is the 20 area, which was a key high reached in 2016. However, if you notice the giant rally this ETF had from last February to until August (from around 5 to around 20); there is big further potential upside if this rally shows some serious legs. Breaching the 14 or 13 levels would likely be triggers to exit the ETF on a stop-loss.
Disclosure: None.


Nice read Moby. I see you have a new company - Wyatt Investment Research. No longer with Big Trends?
Moby, thank you for your insight into $SILJ. I've been looking for an alternative to $GLD ever since I did my due diligence into that fund and found it to be quite shady. GLD so famously claim that they are 100% backed but obstinately refuse to give investors access to any of the 'claimed' gold. Why? There are many profitable gold selling businesses in the world. GLD could even charge exorbitant fees for delivery of said gold but they don't for some strange reason.
The frequently referenced GLD subcustodian audit loophole makes me question this fund even more. What guarantees do we have that they have not leased the gold from someone else? i.e. HSBC. Are they leasing it to someone else? How many claims are there on the gold aka hypothecation? GLD's structure seems to be deliberately vague and intentionally flawed. GLD's custodian, HSBC, with their long history of fraud certainly do not inspire confidence either.
For anyone interested in GLD but have not heard about CNBC's Bob Pisani's visit to GLD's #gold vault, I recommend checking it out. His visit is documented in a segment called Gold Rush: The Mother Lode. This entire segment was organized by GLD's management to prove that their gold actually exists but the gold bar held up by Mr. Pisani displayed a serial of ZJ6752. This serial did not show up on the latest bar list during that time. Cheviot Asset Management’s Ned Naylor-Leyland discovered that this "GLD" bar actually belonged to ETF Securities.
Note that even on the subject of GLD's questionable insurance, they are not at all straightforward about it. Their representatives will not confirm nor deny the existence of GLD's insurance. I recommend anyone curious about this to confirm via calling GLD's publicly listed number for general inquiries at (866) 320-4053 and ask about this clause from the GLD prospectus: "The Custodian maintains insurance with regard to its business on such terms and conditions as it considers appropriate which does not cover the full amount of gold held in custody." Exactly how much of the fund is insured? They will not give you a straight answer and might even throw in some bizarre excuse which I've experienced. Why hide this information from investors? The people behind GLD certainly do not seem like the most honest types.