
Retailer Seasonality: 2017 Is A Different Year
I have been harping on retail as a contrary investment and trade for the past month or so. A reader prompted me to consider whether a seasonal element helps explain the current run-up that has turned into a bona fide breakout for the SPDR S&P Retail ETF (XRT). Turns out the answer is “not really.”
XRT was introduced in 2006. The following chart shows full-year performance for XRT from 2007 to 2016 and year-to-date performance for this year. The thick black curve represents 2017. The purple vertical line is the approximate point at which XRT turned up from its low of the year. I sorted the legend by the arrangement of the graph from top to bottom based on the last trading point of the given year.
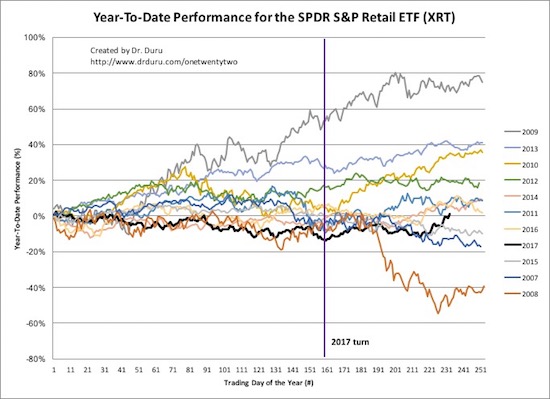
The SPDR S&P Retail ETF (XRT) tends to perform best in the first half of the year. This year’s second half run is atypical.
Source for data: Yahoo Finance
XRT tends to perform better in the first half of the year (through trading day #125) than in the second half. This behavior was especially true in the negative years of 2007, 2008, and 2015. The current run-up in XRT is unlike any other year. In 2010, XRT rallied from August like this year, but the index suffered no significant setbacks along the way. This year, XRT sold in October and through early November. Last year, a rally in XRT launched in November similar to this year. Unfortunately, a sell-off in December forced XRT into a near flat close for the year. This year, XRT is just now back to even year-to-date.
The only other year where XRT made a sharp rally into year-end from a mid-year low was in 2010. XRT made a milder rally into year-close in 2014 with a low made in late October.
In other words, seasonal analysis does not help explain the current rally, but I do see some validation in my expectation for a recovery year in 2018 for XRT.
I also look at the above chart and think that turning in a positive performance this year is important for staving off fresh recession concerns. I am duly noting that XRT lost 16% at the end of 2007, surely one of many harbingers of trouble to come. Two years ago, XRT lost 10% for the year.
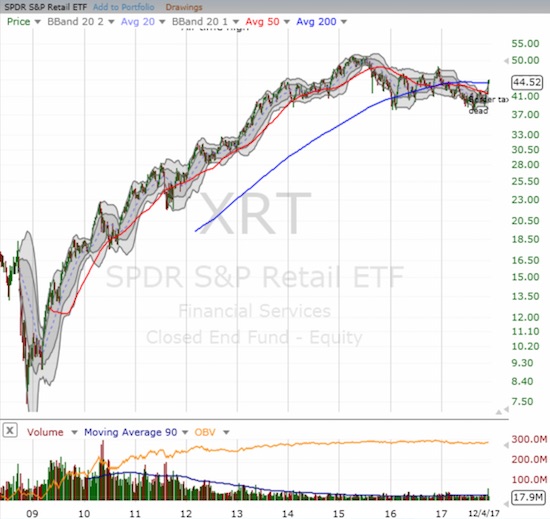
The SPDR S&P Retail ETF (XRT) rallied sharply off the recession lows in 2009 but hit a brick wall in 2015. Now, a 2-year consolidation period has unfolded.
Source: FreeStockCharts.com
Full disclosure: long XRT call options
Follow Dr. Duru’s commentary on financial markets via more


