
Monthly Retail Sales Expected To Climb As S&P 500 Looks To Hold Above 200-DMA
It’s funny what a difference a week can make in the markets. Up until last week, the equity market picture looked rather bleak, with investor sentiment waning and record-setting volatility. But all of that seemed to have subsided in last week’s trade as the major averages marked their strongest week in quite some time. On Friday, the Dow Jones Industrial Average rose 91.64 points, or 0.4%, to 24,831.17, marking its seventh straight positive session, its longest winning streak since a similar stretch that ended Nov. 8, 2017. The S&P 500 rose 4.65 points, or 0.2%, to 2,727.72, up 1.5% and finishing the week above its 50-DMA. The Nasdaq Composite Index meanwhile, lagged behind its peers, finishing down 2.09 points, or off less than 0.1%, at 7,402.88, and ending its multiday run-up of five consecutive advances after Nvidia reported lackluster results.
Both the Dow Jones Industrial Average and the S&P 500 is more than 5% below their record highs and have been in their longest stretch in correction territory since the financial crisis of 2008. Moreover, both indices dropped below their 200-DMA recently and before breaking above their 50-DMA last week. The chart below identifies the S&P 500 breaking below the 200-DMA intraday, but managing to close above the key support level intraday last week.
“Ari Wald, head of technical analysis at Oppenheimer, said that the number of net new lows had been dropping, a trend that suggests “the selling in stocks is getting less bad.” He added, “This means that we’ve been holding up well in periods of consolidation and that the market has been finding a base. This is setting us up for the next move higher in the bull market.”
While there were many positive takeaways from the market’s performance last week, it remains important to continue factoring in the macro-headwinds. Such headwinds could serve to stall out a rally that investors are cheering. But before we denote the macro-headwinds, let’s take a look at one indicator that has historically forecasted strong market performances nearly 90% of the time.
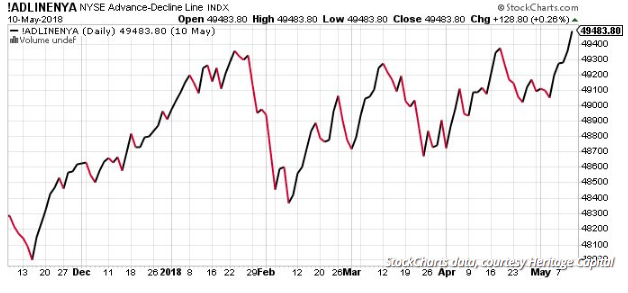
The ratio of rising stocks on the New York Stock Exchange to the number of falling stocks is known as the “advance/decline line”. It has a high accuracy rate of forecasting market moves and was recently noted in Heritage Capital’s weekly letter to clients by Paul Schatz, the firm’s president. Currently, the NYSE’s advance/decline line is at an all-time high, as seen in the following graphic from StockCharts, which Schatz included in an email.
With some of the more positive market commentary and potential now detailed, let’s get back to those macro-headwinds that may prove to impact markets to one degree or another in the weeks and months ahead. We’ve taken the liberty of listing those macro-headwinds below:
- Government and private-sector cybersecurity experts in the United States and Israel worry that President Trump's decision to pull out of the Iran nuclear deal this week will lead to a surge in retaliatory cyber attacks from Iran.
- House Speaker Paul Ryan has now sought a deadline of May 17 for word of a new North American Free Trade Agreement (NAFTA). He said Congress would need to be notified by then in order to approve it.
- U.S./China trade dispute continues with top economic advisor discussions planned. White House spokeswoman Sarah Sanders said on Monday Liu, Chinese President Xi Jinping'stop-ranking economic adviser, would come to Washington next week "to continue discussions with the president's economic team."
- While the Fed hikes interest rates, it's also shrinking its balance sheet. The Fed is currently unwinding its $4 trillion-plus balance sheet at an ever-increasing pace. Markets are taking another 25 basis-point hike from the Fed at its June meeting as a near certainty, based on CME Group fed funds futures.
- Louis Fed President James Bullard said that after being dislocated over the past decade, suppliers of labor, or households, are now on the same footing as employers. He also said the U.S. wasn’t in any danger of a breakout of inflation, but that he was worried the yield curve could invert as soon as September.
While all of these macro-factors are critical to the S&P maintaining positive movement in the weeks and months to come, we’ll focus on that which there is a greater certainty, the Fed, and rising rates. The fact that the Fed is unwinding its balance sheet while hiking rates (tightening) is a double whammy for investors and stocks. Of the last 13 rate hike cycles, 10 have resulted in a recession. As such, it’s of no surprise that bond yields have been steadily rising in 2018 and with the 10-yr. U.S. Treasury now yielding roughly 3 percent. A 3% 10-yr yield has not been seen since 2014 and is rather innocuous in a vacuum. But investors don’t live in vacuums and can often live by levels… one level at a time having a negative sentiment affect in favor of less risky assets.
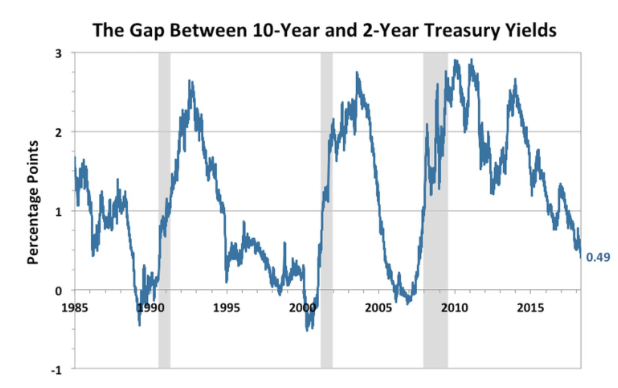
It’s almost a certainty that the yield curve will again invert, it’s just a matter of when the inversion will occur. At present, the spread between the 2-yr. Treasury and 10-yr. Treasury yield is a mere .44 basis points as shown in the graphic below:
Many are of the opinion that an inverted yield curve could happen as early as this fall. But will it forecast a recession is the real question? That’s what has partially caused a great deal of angst in the markets this year already; are we heading into a recession or not?
While many, not all but many, recessions have been proceeded by an inverted yield curve, Federal Reserve Chairman Jerome Powell does not foresee this rate hike cycle and yield cycle as being fairly represented through a historic lens. Recall that at his first press conference as the head of the central bank in March, Powell stated the following when asked about the yield curve inverting and a potential resulting recession thereafter.
"It's true that yield curves have tended to predict recessions if you look back over many cycles. But the near-flawless record of using an inverted curve - short rates above long rates - no longer applies in the current economic climate. History, in short, is misleading.”
“A lot of that was just situations in which inflation was allowed to get out of control and the Fed had to tighten and that put the economy into recession. That's really not the situation we're in now.”
We are seeing reflation, but runaway inflation simply isn’t occurring and therefore the rate cycle hikes can be engaged as the data comes in monthly. With that being said we can review the various forecasts for yield curve inversion and economic growth. Here is the latest forecast from the Cleveland Fed noted below:
“The flatter yield curve had a slightly more visible effect on the estimated probability of recession, which increased a bit. Using the yield curve to predict whether or not the economy will be in recession in the future, we estimate the expected chance of the economy being in a recession next April at 13.8 percent, just up from March’s probability of 13.4 percent, itself up from February’s 11.1 percent. So the yield curve is optimistic about the recovery continuing, even if it is somewhat pessimistic with regard to the pace of growth over the next year.”
So while there is still a good many issues investors must contend with for greater investor confidence in the months to come, it would appear as though the current economic cycle is expected to continue to grow. Such growth can also be found from the established quarterly S&P 500 corporate earnings growth forecasts. With the Q1 2018 earnings season winding down and nearly 85% of S&P 500 companies having reported in previous weeks, we’ll now take a look at the most recent forecast for S&P 500 earnings from Thomson Reuters.
Aggregate Estimates and Revisions
- First quarter earnings are expected to increase 26.0% from Q1 2017. Excluding the energy sector, the earnings growth estimate declines to 24.0%.
- Of the 455 companies in the S&P 500 that have reported earnings to date for Q1 2018, 78.2% have reported earnings above analyst expectations. This is above the long-term average of 64% and above the average over the past four quarters of 75%.
- First quarter revenue is expected to increase 8.2% from Q1 2017. Excluding the energy sector, the revenue growth estimate declines to 7.7%.
- 8% of companies have reported Q1 2018 revenue above analyst expectations. This is above the long-term average of 60% and above the average over the past four quarters of 69%.
- For Q2 2018, there have been 44 negative EPS preannouncements issued by S&P 500 corporations compared to 35 positive, which results in an N/P ratio of 1.3 for the S&P 500 Index.
- The forward four-quarter (2Q18 – 1Q19) P/E ratio for the S&P 500 is 16.7.
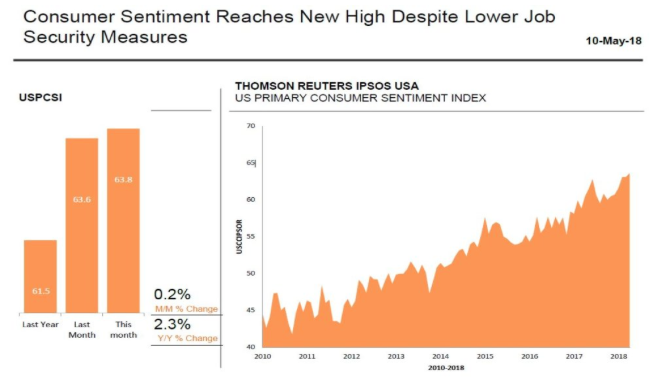
Now let's take a look at what drives the U.S. economy, consumer spending and sentiment. Here is the most recent consumer sentiment index reading by Thomson Reuters. As one can see from the chart below, consumer sentiment reached a new high.
Retail reporting season began in earnest last week, but a good many retailers will highlight the earnings schedule this week and next week. Some retailers like Macy’s and Kohl’s received downgrades last week, but CNBC’s Jim Cramer believes that the analysts may have gotten the stories wrong.
"Here's the bottom line: we have lots of retailers reporting next week, and while we've seen a bunch of downgrades of the group lately, I think that the stronger consumer, courtesy of tax reform, could result in some fabulous upside surprises.
Throw in the tech stocks that come next week, which I think are ready to roar, and we might have what we need for yet another bullish backdrop."
The long-term narrative for many brick & mortar retailers remains in question given the draw to online sales by consumers. On another important retail note, come Tuesday, investors will be able to see if the resurging retail sales from March had some staying power. Retail sales grew at .6% MoM in March, outpacing expectations and marking its first positive result since declining in each of the previous 3 reports.
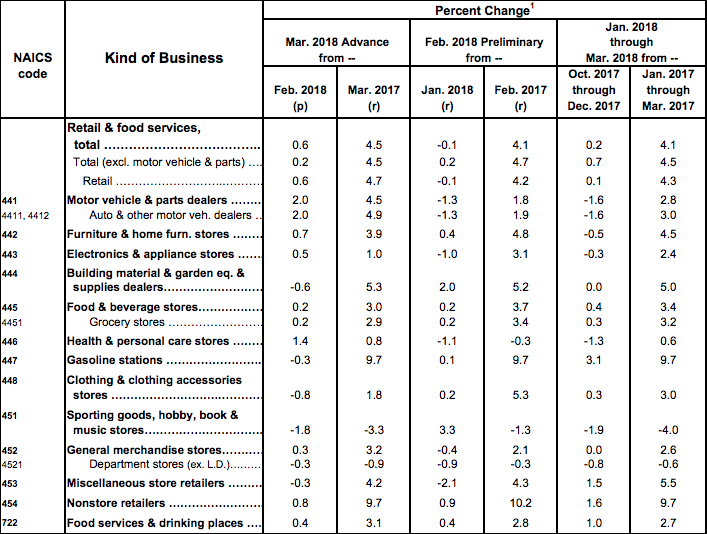
Unfortunately, it wasn’t all good news in the monthly report for March, as department store retailers lost ground to Nonstore retailers, falling both MoM and year-over-year. So what are economists expecting from the Census Bureau when it reports April retail sales? According to economists polled by FactSet, April retail sales are expected to grow .6% once again. There had been little weather impacting retail sales during the month of April although an early Easter may have some seasonal affect on the data. Having said that, tax refunds are now fully impacting the data with consumer sentiment coming in strong.


