
Market Trends, Reversions & Analysis

People ask me all the time why I write so much.
Here is the funny part, when I write I am writing for me. The process of writing helps me distill down the daily barrage of financial information into a more focused analysis to help me in the management of portfolios.
From time to time my writings are picked up by other sources, which is both flattering and humbling, which leads to comment threads by readers. These comments are the most enlightening and educational parts of my day.
I have learned two things in particular.
The first is there is a visible dichotomy between those who lived through the “Financial Crisis”and those who made their first investments afterward. The former has a clear understanding of what happens to capital during a major market correction and the effort required to recoup those losses. The latter has a clear belief “this time is different” and the market can only go higher from here.
The second is there is clear misunderstanding of the difference between “understanding and recognizing risks” and investment posturing (aka being “bearish.”)
Currently, our portfolios are nearly fully allocated. As I have discussed over the last couple of months we have added “risk off” trades due to the extreme bifurcation in the markets. We have also added Russell 2000 and international exposure along with various sector exposure and broad market coverages.
This is hardly bearish by any means.
As such, if the market continues to rise, that’s great for my clients and my portfolios.
But telling you why the market will keep going up is hardly a useful exercise. For that simply turn on any financial television program or read any mainstream financial publication. Bullishness always reigns. Maybe you should ask yourself why? (Optimism sells products, services, and advertisers.)
For me, when I write, I am analyzing the data for where I could be wrong in both my short, as well as my intermediate-term, outlook. That doesn’t make me bearish, although it may sound that way. What you are reading is my struggle to battle “confirmation bias.”
And…that is where we are today.
The Bullish View
As I noted last week:
“A ‘buyable correction’ would suggest a correction back to recent support levels that keep the overall ‘bullish trend’ intact.“
It is the last part of that sentence which is most important in the SHORT-term.
As the monthly chart of the S&P 500 shows below, the bullish trend currently remains firmly entrenched. The market continues to trade above the running bullish trendline AND the 24-month moving average. Currently, it would require a break below 2100 to suggest a change of trend is in the works.

This short-term bullish trend mandates that portfolios remain exposed to equity-related risk as long as corrections do not violate either the 24-month or upwardly trending bullish trend.
Rule #1: In a bullishly trending market portfolios should only be long or neutral.
However, eventually, something will happen to “change the trend” from upwardly sloping to downwardly sloping which will be identifiable by a break of the supportive trendlines. In such a case the second rule applies:
Rule #2: In a bearishly trending market portfolios should only be neutral or short.
For now, the markets are clearly bullish as optimism and exuberance reign.
The Bearish View
It is the over-optimistic and exuberant outlook currently that gives me caution as to the intermediate and long-term views. As noted last week by Brad Lamensdorf there are multiple indications that suggest a much higher degree of long-term caution. To wit:
“Extremely high positive sentiment remains problematic, suggesting that a significant amount of funds available for investment have already been committed. As we’ve mentioned, sentiment is a contrarian indicator, and extremes typically mark tops and bottoms. Bullish newsletter writers stand at 60.6%, which is an 18-month high. Bearish newsletter writers have fallen to just 17.3%.“
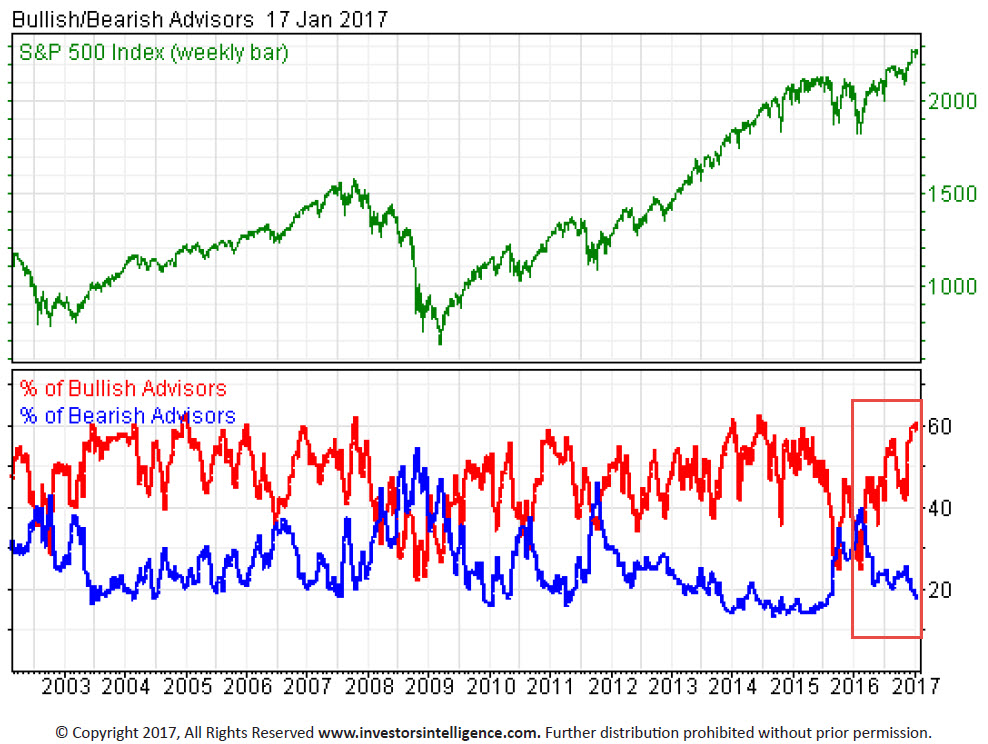
“The bull/bear ratio is now in the danger zone at 43.3%. The smart money/dumb money confidence gauge, a proprietary indicator published by sentimentrader.com, reinforces our view on sentiment. The current spread is exceedingly high, which is another negative for sentiment in general.”

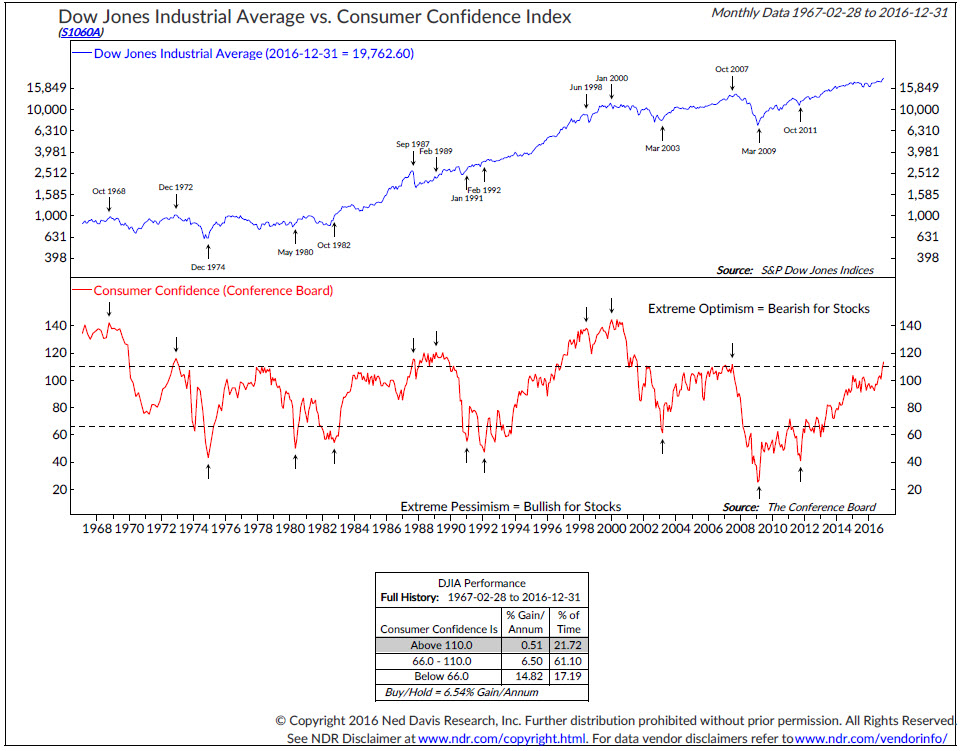
“The consumer confidence index measures the confidence level of the general public on the economy based on spending and savings. This tool is not directly linked to the stock market. However, it can be useful for spotting when expectations have become too extreme in positive or negative directions. The current reading of 113 is at its highest in over 15 years. Going back further one can clearly see the elevation of the index in the 1980’s and 1990’s, recessions occurring at each point thereafter. Extremes typically occur at the beginning or end of a trend. Current expectations are definitely running high!”
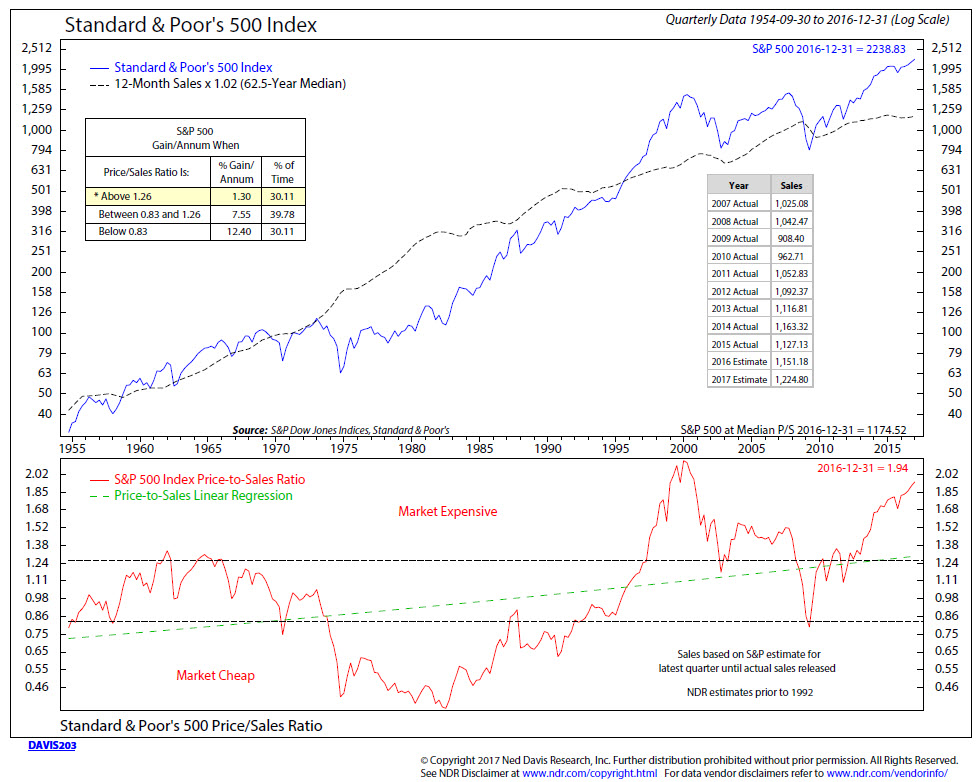
“Unlike earnings, which can be easily ‘massaged’, sales are much more difficult to manipulate. The price-to-sales on the S&P500 is at its second highest in history, rivaled only by the 2000 bubble.”
These are just a few of the many indications of the extreme deviations which currently exist. This is in addition to the numerous points I have noted previously of extreme positioning in the markets as well.
When all of these measures are combined, the “risk” in the market currently far outweighs the potential for “reward” over the intermediate to long-term time frames. No chart shows that better than the quarterly view of the markets below.
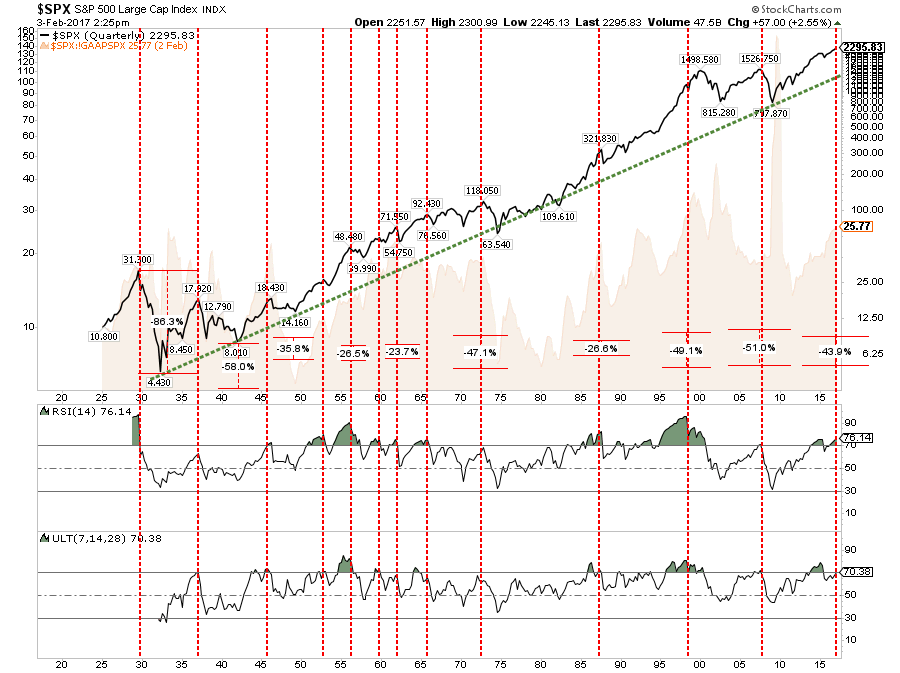
As you will notice, each time there has a been combination of extreme overbought conditions (red vertical dashed lines) combined with high valuations, which coincides with market exuberance, the resulting corrections back to the long-term logarithmic trend line (green dashed line) has not been kind to investors.
Currently, such a correction would entail a decline in the market by more than 40%.
That’s not being bearish.
That’s just a historical fact.
Market Analysis & Warnings
Since I did a an extensive review of the major markets and domestic sectors last week, not much has changed this week other than the VIX hitting even lower lows. If you didn’t catch last week’s piece it is worth reviewing.
I did find some very interesting research pieces which I thought were worth sharing with you as they are supportive of much of my own analysis.
The Other Dow Theory Indicator
Dana Lyons pointed out something I missed with respect to the “Other Dow Theory Indicator.”
“One such divergence dealt with the sister index of the DJIA and DJT, i.e., the Dow Jones Utility Average (DJU) (as an aside, for all you Dow Theory disciples, we are not applying the actual Dow Theory rules to the DJU, just the divergence statistics). As it turns out, large divergences of the Utilities historically demonstrated much more reliability as a harbinger of trouble than the Transports, according to our study.
We bring this up today because while the DJIA continues to hang up near its highs, the DJU is once again diverging, sitting well off of its 52-week highs. Thus, we revisited the 2015 post and updated the divergence study. Specifically, we looked for any time that the DJIA traded at a 52-week high while the DJU was at least 10% below its own high. Since 1943, there have been 73 days matching this criteria (many of the dates fell in clusters; though the clusters were of similar numbers of days so we included all such days).”
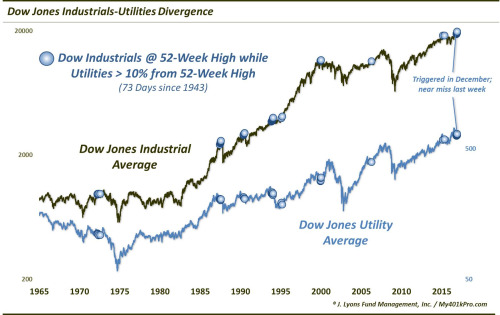

“As the table shows, in the intermediate-term following these divergences, returns on both the DJIA and the DJU were exceptionally weak. After 3 months, the DJIA was lower by a median -4.1%, with 80% of the occurrences showing losses. The DJU was also down a median of -4.1% after 3 months, with 75% losers. 6 months after the events, median returns were even worse for the DJIA and DJU at -4.9% and -7.5%, respectively. And even out to 12 months, the majority of these divergences saw both indices lower.
So while the recent simultaneous, confirming highs in the Dow Industrials and Transports has Dow Theorists quite bullish at the moment, the lesser-watched relationship between the DJIA and the Utilities is not quite so positive.”
I Don’t Care About The Price, Just The Dividend
One of the most common things I hear from individuals is:
“I really don’t care about the price of the stock, just the dividend.”
#BullS***.
This is a mantra that is ONLY stated near major market peaks.
The reality is that when the prices of equities fall two things nearly always happen:
- The individual will ultimately “panic sell” as the loss of capital exceeds the mental pain threshold.
- The reason the stock is falling is generally fundamental which leads to a cut in the dividend.
Dividends are a function of your total return. Which means that capital preservation is required as a part of your long-term investment success.
However, here is a more important point from Political Calculations:
“While that figure [number of firms cutting dividends] is still elevated well above the level that is consistent with some degree of contraction occurring within the U.S. economy, it also represents a decline from the year ago figure of 55, which had come as part of a rising trend for dividend cuts that resulted from the economic distress unleashed by the sustained collapse of oil prices on the U.S. oil and gas industry, which lasted from July 2014 through February 2016.”
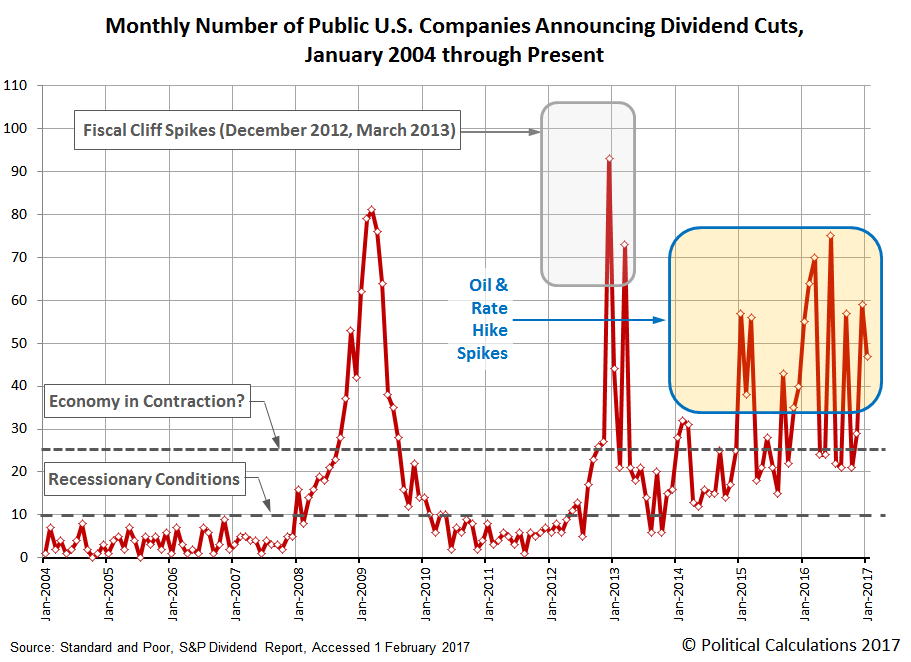
“Today, some elements of that distress is still lingering in the U.S. oil sector, where oil prices have somewhat recovered and have stabilized, but the effect of rising interest rates is also taking a toll. Finance-oriented firms and other interest-rate sensitive entities such as mortgage-related Real Estate Investment Trusts (mREIT) have become more common in the count of companies that have announced dividend cuts over the last 16 months, as the Federal Reserve has frequently threatened and occasionally acted to drive up short-term interest rates in the U.S. during that time.”
Here is the point.
Buying a stock for the dividend alone, and forgetting about the important function of price, is a dangerous way to invest your portfolio. While you may have the best of intentions to hold out for the long-term and collect “the check,” it is not a smart way to manage your portfolio as many found out during the last financial crisis.
The Stock-Bond Warning
Michael Kahn had a good piece this week which reiterates a point I have made over the last couple of months about the relationship, longer-term, between bonds and stocks.
“While I still believe the stock market has a date with higher prices this year, the past few days have shown that the path is not likely to be smooth. Right now I see a few items that investors should monitor.
The first is interest rates. In December I took a look at long-dated Treasury yields and concluded they had topped out for the time being. The iShares 20+ Year Treasury Bond exchange-traded fund, which tracks long bond prices and moves inversely to interest rates, landed in a very major support zone”
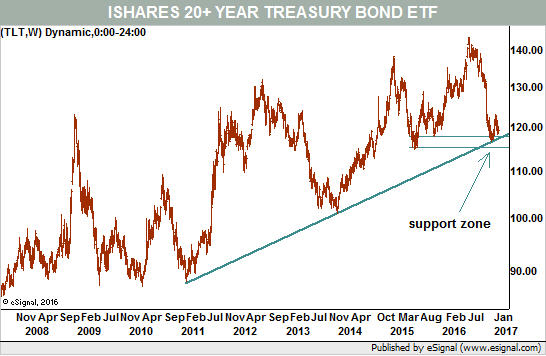
“The inability for any market to move significantly higher after reaching a major support area is a bearish warning. Should the bond ETF break down, it would push long-term interest rates higher, and I suspect that would be a negative event for the stock market. This, despite market expectations for only two quarter-point federal-fund rate hikes this year.
The opposite end of the quality scale in the bond market also has a potential breakdown in play. Whereas Treasury bonds are considered to be default risk-free, high-yielding ‘junk’ bonds do carry significant risk. Major ETFs tracking junk bonds, such as iShares iBoxx $ High Yield Corporate Bond, have already seen arguable breakdowns from the post-election rally”
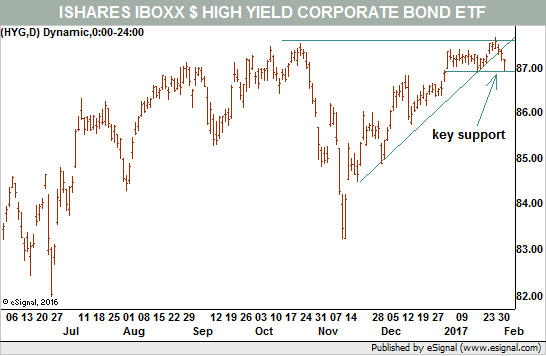
“All told, this is not a positive for stocks as it tells us that investors may be fleeing riskier assets. Junk bonds can be the canary in the coal mine for the stock market.”
There is NO SUBSTITUTION for risk management in a portfolio.
#PortfolioHedgesMatter
Market & Sector Analysis
Data Analysis Of The Market & Sectors For Traders
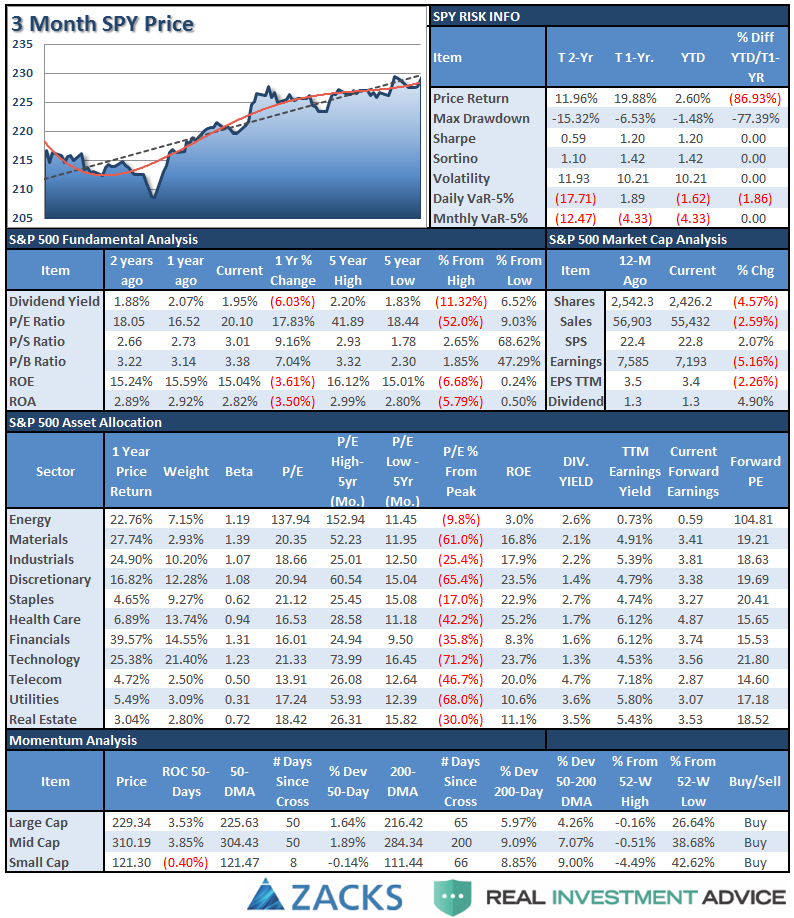
S&P 500 Tear Sheet
The “Tear Sheet” below is a “reference sheet” provide some historical context to markets, sectors, etc. and looking for deviations from historical extremes.
If you have any suggestions or additions you would like to see, send me an email.
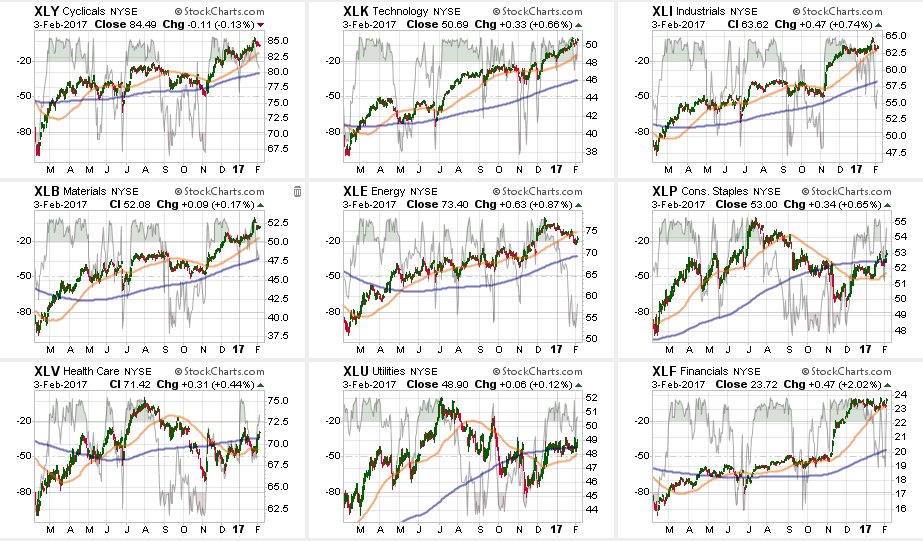
Sector Analysis
Comments
With “Week 2” of the new administration behind us, and a flurry of “executive orders” being issued, the markets were saved on Friday by an “order” to effectively repeal the “fiduciary rule” of Dodd-Frank effectively putting the “Wolf Of WallStreet” back in the proverbial “Investor Hen House.”
As I tweeted on Friday:
Follow
@realDonaldTrump Since you repealed Dodd-Frank, how about reinstating FASB Rule 157 and Glass-Steagall to protect the retail investor?
- RETWEETS17
- LIKES29


12:23 PM - 3 Feb 2017
This order sent financial stocks rocketing higher on Friday which pulled the markets higher into the close and offsetting the drag from AMZN following their earnings announcement.
For the second consecutive week, the S&P Index finished higher with a 0.12% or 2.73 point gain. However, the reversal from early trading low was a total reversal of 30 points for the week.
The Rotation Continues
Over the last couple of months, I have been discussing the coming rotation of the “risk on” versus the “risk off” sectors in the market. As I noted (with a video) at the beginning of the year, these rotations usually are early indicators of a “risk off” transition and provide opportunities for investors.
As you can see, that rotation has continued to accelerate over the last couple of weeks.

This rotation is still likely early in its movement. As noted above, while RISK bullishness has reached extremes, SAFETY has been completely disregarded. Reversions tend to be rapid.
More importantly, from a historical viewpoint, and as I discussed this week, corrections in the month of February tend to amass towards the end of the month.
“A look at daily price movements during the month, on average, reveal the 4th trading day of February through the 12th day provide the best opportunity to rebalance portfolio allocations and reduce overall portfolio risk.”
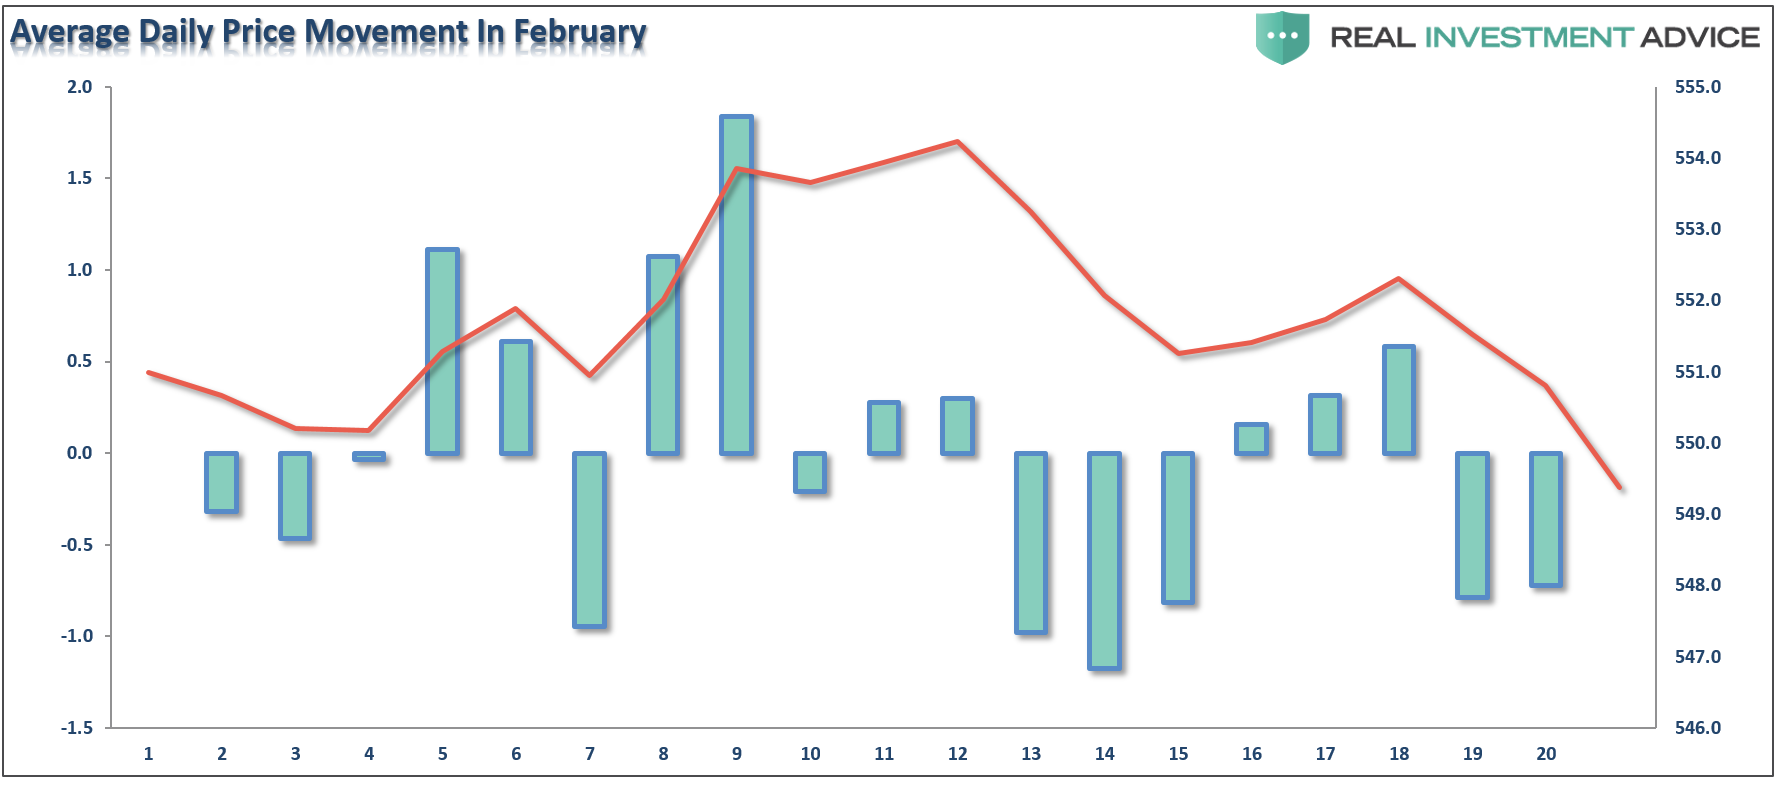
In other words, don’t let this week’s rally fool you. It is historically very well aligned with normal early February advances. The “risk off” trade is likely telling us something important.
From a position view, Technology pushed higher last week along with Staples, Health Care, Utilities, Financials, and Materials. Discretionary and Industrials lagged while Energy broke below its 50-dma.
From the broader index positioning:
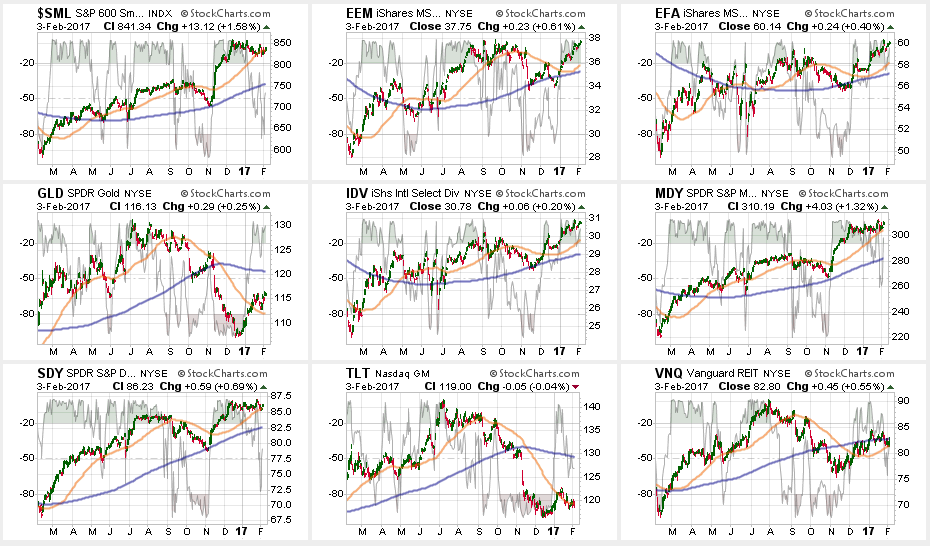
Small Caps, REIT’s, Mid Caps, Dividend Stocks and Bonds continue to flirt with their respective 50-dmas. Emerging and International markets got a lift from the weakening dollar which prompted an increase in International weightings in portfolios last week from a trading perspective.
Gold retested its 50-dma and bounced higher which is a technical improvement but remains locked in a long-term downtrend.
The table below shows thoughts on specific actions related to the current market environment.
(These are not recommendations or solicitations to take any action. This is for informational purposes only related to market extremes and contrarian positioning within portfolios. Use at your own risk and peril.)

Portfolio Update:
Eight weeks ago, as suggested, we hedged our long-equity positions with deeply out-of-favor sectors of the market (Bonds, REIT’s, Staples, Utilities) which have continued to perform well in reducing overall portfolio volatility risk.
Early this past week we added two new positions from a “Trading” perspective only: IWM – Russell 2000 and VEA – International.
The short-term bullish trend and technical setup required an increase in equity risk in portfolios. However, all positions maintain very tight trailing stops as the mid to longer-term dynamics of the market continue to remain very unfavorable.
As I have been warning over the last couple of months, the stronger dollar and the rise in rates should not be dismissed.
Everything is currently pointing to this being a very late stage advance, so profit taking, hedging, and rebalancing remains strongly advised.
THE REAL 401k PLAN MANAGER
The Real 401k Plan Manager – A Conservative Strategy For Long-Term Investors
There are 4-steps to allocation changes based on 25% reduction increments. As noted in the chart above a 100% allocation level is equal to 60% stocks. I never advocate being 100% out of the market as it is far too difficult to reverse course when the market changes from a negative to a positive trend. Emotions keep us from taking the correct action.

Trump – Week Two
First, the answer is “NO.” I am not going to continue counting the number of weeks of the Trump Presidency.
Secondly, as reiterated last week:
“I would NOT be surprised for the markets to have a ‘relief rally’ next week and make a push for ‘Dow 20,000.'”
Well. That happened and I got to put my “Dow 20,000” hat back on again.
While there really isn’t any “bad news” to speak of, the extension of the market continues to remain extreme. A correction is needed to allow for an increase in 401k exposure for the remainder of the “seasonally strong” period. As noted above, we are in the early stages of a “risk off” rotation which suggests a mild correction is likely in store during February.
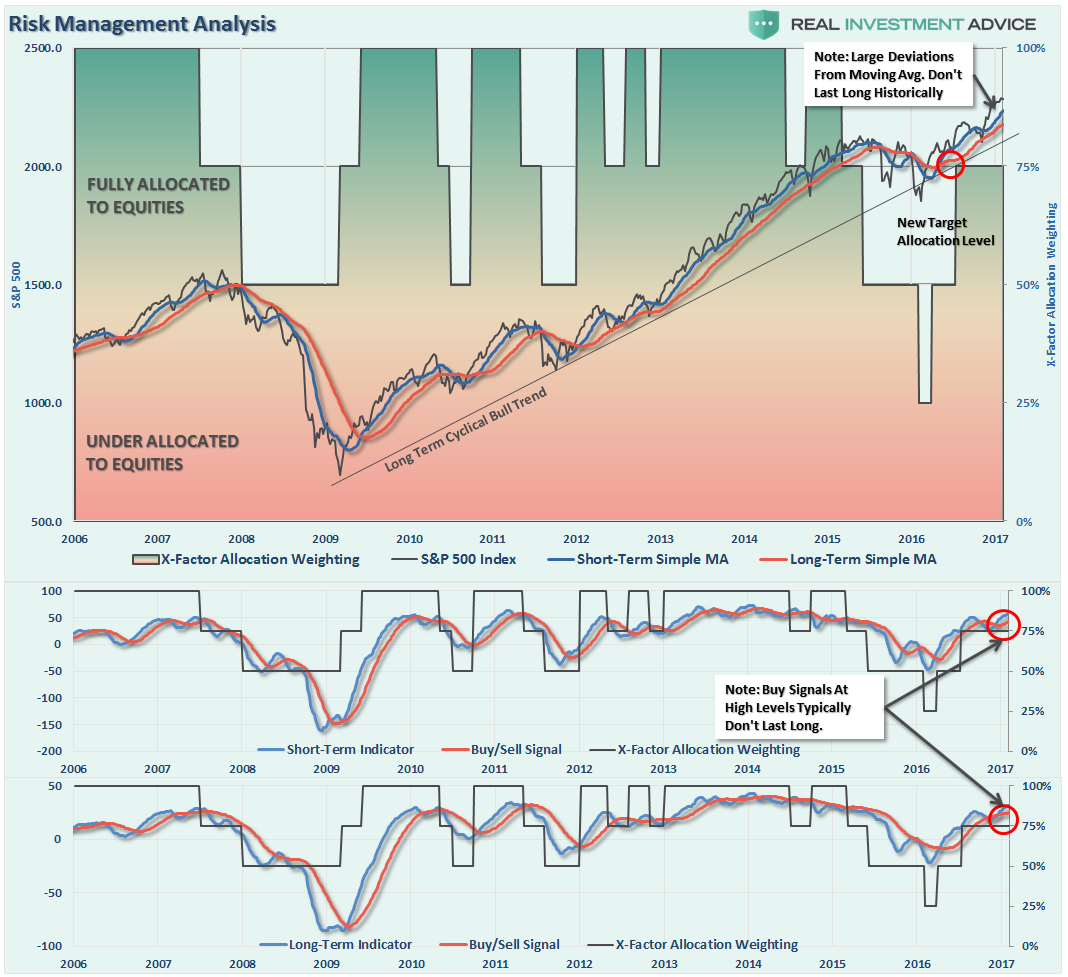
With buy signals on all three indicators registered currently, any corrections are likely to be somewhat limited back to the rising short to intermediate-term moving averages.
This would suggest a correction back to 2250 on the S&P 500 would likely be a “buyable” trading level. As noted in the chart above, the current extension above the moving average will likely be corrected in fairly short order. Such a correction will relieve some of the extreme overbought conditions that currently exist and allow for additional risk exposure in portfolios if needed.
As suggested last week, due to the current extremes on many fronts, investment risk remains elevated which is why I have not increased the allocation model to 100% as of yet. This is also why I have suggested over the last couple of weeks to use this current advance, and extension, as an opportunity to clean up portfolios. (Use guidelines noted previously.)
- Tighten up stop-loss levels to current support levels for each position.
- Hedge portfolios against major market declines.
- Take profits in positions that have been big winners
- Sell laggards and losers
- Raise cash and rebalance portfolios to target weightings.
If we can get a correction that resolves the overbought, extended and excessively bullish backdrop to the markets currently, I WILL increase the allocation model to 100%. For now, we will wait and let the markets tell us what it wants to do next.
If you need help after reading the alert; don’t hesitate to contact me.
Current 401-k Allocation Model
The 401k plan allocation plan below follows the K.I.S.S. principal. By keeping the allocation extremely simplified it allows for better control of the allocation and a closer tracking to the benchmark objective over time. (If you want to make it more complicated you can, however, statistics show that simply adding more funds does not increase performance to any great degree.)

401k Choice Matching List
The list below shows sample 401k plan funds for each major category. In reality, the majority of funds all track their indices fairly closely. Therefore, if you don’t see your exact fund listed, look for a fund that is similar in nature.

Disclosure: The information contained in this article should not be construed as financial or investment advice on any subject matter. Streettalk Advisors, LLC expressly disclaims all liability in ...
more


Thanks for sharing