
Looking At Futures Positions For The Week
Following futures positions of non-commercials are as of August 14, 2018.
10-year note: Currently net short 698.2k, up 111.9k.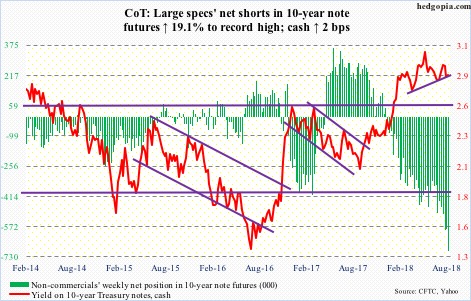
In the 12 months to July, the US Treasury issued $544.1 billion in notes and bonds. A year ago, issuance totaled $335.1 billion. In the 12 months to June, the federal budget deficit totaled $749.8 billion, down from $765.2 billion in May, but this has persistently risen since bottoming at $403.6 billion in January 2016. In all probability, thanks to last December’s tax cuts and subsequent increase in the budget, the red ink only grows from here. Bond vigilantes know this. In the meantime, foreigners have reduced their purchases of T-notes and bonds. In the 12 months to June, they in fact sold $7.4 billion worth, versus purchases of $92.2 billion in February. Plus, the Fed has been cutting back on its treasury holdings. It currently holds $2.17 trillion in notes and bonds, down from $2.35 trillion in October 2014.
Yet, the 10-year T-yield (2.87 percent) cannot rally. Well, it did rally from 2.03 percent last September but hit the wall north of three percent. In May, yields rose as high as 3.12 percent, before coming under pressure. This week, bond bears defended the neckline of a potentially bearish head-and-shoulders formation. A convincing break has the potential to squeeze non-commercials, who are heavily net short 10-year note futures – another record. Should this unfold, rates in due course can come under more pressure.
30-year bond: Currently net short 26.5k, down 5.4k.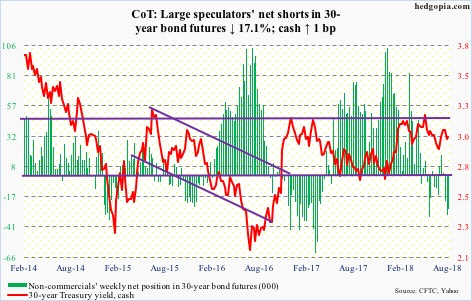
Major economic releases next week are as follows.
Wednesday brings July’s existing home sales as well as FOMC minutes for the July 31-August 1 meeting.
Sales fell 0.6 percent month-over-month in June to a seasonally adjusted annual rate of 5.38 million units. Last November’s 5.72 million was the highest since February 2007.
New home sales for July are on tap Thursday. June was down 5.3 percent m/m to 631,000 units (SAAR). Last November’s 712,000 was the highest since October 2007.
Also on Thursday, the annual Jackson Hole symposium begins and runs through Saturday.
July’s durable goods orders are scheduled for Friday. June orders for non-defense capital goods ex-aircraft – proxy for business plans for capex – jumped 7.8 percent year-over-year to $68.5 billion (SAAR).
Crude oil: Currently net long 621.6k, down 35.2k.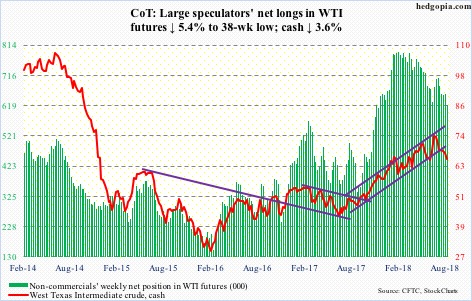
Last week, spot West Texas Intermediate crude ($65.21/barrel) slightly breached a rising trend line from June last year. This week, the underside of that trend line resisted rally attempts. The crude also lost support at $66-67, before proceeding to test the 200-day moving average. This was a first test of the average since last October – successful thus far. The daily chart is oversold enough the crude can rally some. There is solid resistance at $69-69.50. If WTI is unable to rally, oil bears in due course would be eyeing to test a rising trend line from February 2016 which lies around $56. That was when WTI bottomed at $26.05.
The EIA report for the week of August 10 showed US crude stocks jumped 6.8 million barrels to 414.2 million barrels – a six-week high. Distillate stocks increased 3.6 million barrels to 129 million barrels. Crude imports rose 1.1 million barrels per day to nine mb/d. Crude production increased 100,000 b/d to 10.9 mb/d.
Gasoline stocks, however, fell 740,000 barrels to 233.1 million barrels. Refinery utilization rose 1.5 percentage points to 98.1 percent, matching the high of July 2005.
E-mini S&P 500: Currently net long 179.7k, up 14.5k.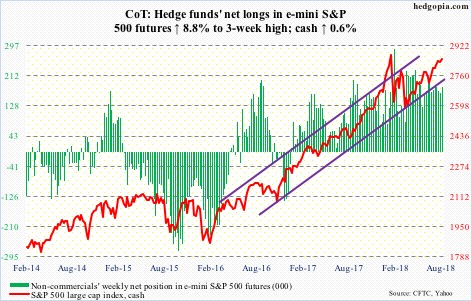
Wednesday, bulls stepped up to defend 2800 – again. The cash (2850.13) broke out of this level mid-July, and has now been tested twice – one this week and one early this month. Flows were in full cooperation as far as S&P 500-focused ETF’s were concerned. In the week to Wednesday, SPY (SPDR S&P 500 ETF), VOO (Vanguard S&P 500 ETF) and IVV (iShares core S&P 500 ETF) respectively took in $1.1 billion, $1.4 billion and $1.5 billion (courtesy of ETF.com). In the same week, US-based equity funds (including ETF’s) lost $639 million (courtesy of Lipper.com).
Foreigners, in the meantime, continue to reduce exposure to US equities. In the 12 months to June, they purchased $30.1 billion, down substantially from January’s $135.7 billion. The S&P 500 peaked on January 26 at 2872.87. Tuesday last week, it came within 9.45 points from surpassing that high. Foreign purchases are worth watching. In February 2016, when the index bottomed, they were selling $145.3 billion, before reversing higher.
Euro: Currently net short 1.8k, down 12.4k.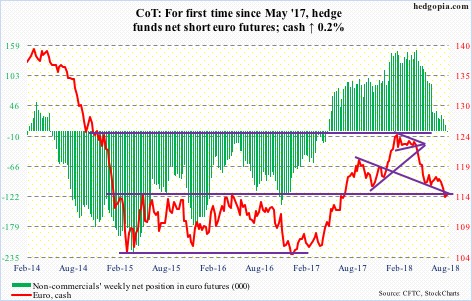
After slicing through $115 last week, the cash ($114.44) has its work cut out. Support at $114-115 was crucial. After going sideways in a rectangle for nearly two and a half years, the euro broke out of this level in July last year. Now this will serve as resistance, where sellers will show up.
For the first time in 15 months, non-commercials are net short.
Needless to say, the currency remains oversold. Immediately ahead, repair work is needed. Shorter-term averages are still dropping, as is the daily lower Bollinger band. There is gap-down resistance at $114.60s.
Gold: Currently net short 3.7k, down 16.4k.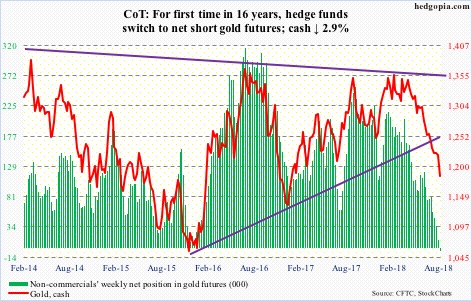
Gold-focused ETF’s saw no letup in outflows. In the week to Wednesday, GLD (SPDR gold ETF) bled $444 million and IAU (iShares gold trust) $13 million (courtesy of ETF.com). GLD witnessed redemptions in 15 out of last 16 weeks, for a loss of $3.9 billion. IAU lost $1.2 billion in the last 13.
At the same time, non-commercials are now net short – first time in 16 years.
Early April, the cash ($1,184.2/ounce) was rejected at $1,360-70, before coming under genuine pressure, losing important moving averages and several trend-line support. As oversold as the metal is, sustained bids are lacking. Thursday’s hammer candle is a step in the right direction, but gold bugs need to recapture $1,210 first.
Nasdaq 100 index (mini): Currently net long 37.5k, up 796.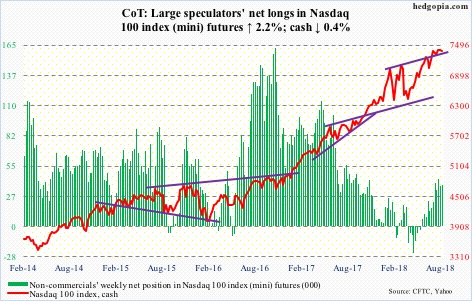
Near-term support at 7300 was defended when the cash (7377.54) came under decent pressure Wednesday. But resistance at just north of 7400 held in the subsequent sessions. Since the Nasdaq 100 peaked at 7511.39 on July 25, bulls are lacking in conviction. That high was rejected at six-month channel resistance. Weekly momentum indicators remain in overbought territory. For bears to get any traction, they need to take out 7300, followed by the 50-day (7281.31).
In the week through Wednesday, QQQ (PowerShares QQQ ETF) lost $200 million (courtesy of ETF.com). Since July 25, $41 million came in.
Russell 2000 mini-index: Currently net long 14.2k, up 1k.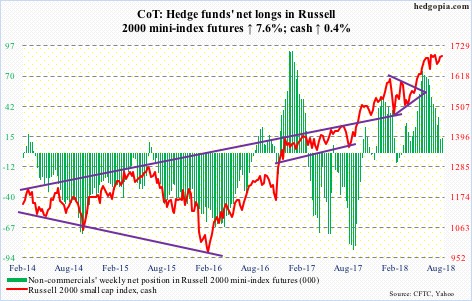
The cash (1692.95) continues to trade within a pennant, the lower end of which was tested both Wednesday and Thursday. Bulls of course hope this eventually resolves to the upside. The formation can be a continuation pattern, as the current sideways move preceded a rally. But in getting thus far, they have also expended a lot of buying power.
Year-to-Wednesday, IWM (iShares Russell 2000 ETF) and IJR (iShares core S&P small-cap ETF) gained a combined $3.8 billion. Beginning June 20, however, when the Russell 2000 hit 1708.10 before going sideways to slightly down these ETF’s are down $271 million. The loss would be a lot more if not for combined inflows of $454 million in the week to Wednesday (courtesy of ETF.com).
IWM short interest is not too elevated, even as non-commercials are cutting back net longs. At least near term, bulls have their work cut out.
US Dollar Index: Currently net long 32k, up 1.9k.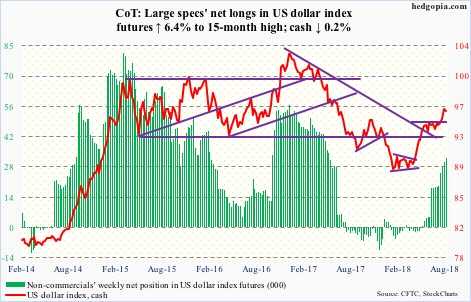
These are the daily candles this week on the cash (95.98) – long-legged doji, solid white, shooting star, hanging man and solid red. These are signs of fatigue. This followed a breakout Friday last week – out of 10-week congestion around 95-plus. Wednesday, the US dollar index hit an intraday high of 96.87. Around here – 96.27, to be exact – lies 50-percent retracement of the decline between July 2001 and April 2008. The level is worth watching. What happens around 95 will be a big tell. This week’s candle was a shooting star.
VIX: Currently net short 131.5k, up 17.7k.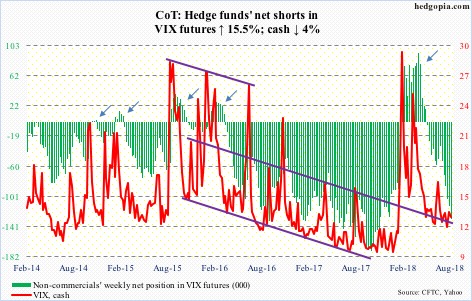
On a weekly basis, there is plenty of room for the cash (12.64) to unwind its oversold condition, but on the daily chart Wednesday’s spike reversal from an intraday high of 16.86 is a sign how difficult it is to bet on persistently rising volatility.
VIX did rise from 10.17 intraday Thursday last week to Wednesday’s high – in mere five sessions. So a pause was natural. But this one looks more like a reversal. Also Wednesday, the VIX–to-VXV ratio intraday hit 0.958 – enough to just about kiss overbought territory. It closed out the week at 0.833. Should it come under more pressure, VIX, which measures 30-day volatility versus VXV’s 90-day, drops more than VXV.
Disclaimer: This article is not intended to be, nor shall it be construed as, investment advice. Neither the information nor any opinion expressed here constitutes an offer to buy or sell any ...
more

