
Housing Market Review – Trend Breaks And A Plunge-Worthy Housing Slowdown
I saw a flicker of hope for home builders in the May Housing Market Review. Traders decided to snuff that flicker out very quickly afterward. When I wrote June’s housing market review and described a “struggling flicker,” the iShares US Home Construction ETF (ITB) was once again bouncing off the bottom of 2018’s trading range. By the time of the September Housing Market Review, ITB was still holding to its trading range, but weakening housing data made for a precarious outlook. In September, ITB finally broke down and hit a 13-month low. THIS month officially ushered in a complete collapse that was very plunge-worthy. So far this month, ITB has lost 13.8% for a 20-month low.
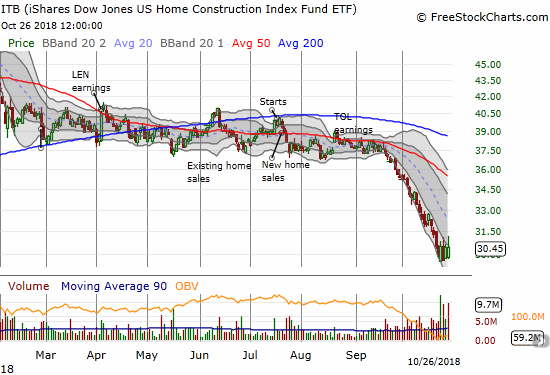
The iShares US Home Construction ETF (ITB) stabilized this past week for the first time in over a month. The index sits at a 20-month low.
Conditions are getting bad enough to drag out the downgrades from analysts. Almost two weeks ago, Bloomberg reported on three analyst downgrades:
“BTIG analyst Carl Reichardt reduced builder earnings estimates for the 2018 and 2019 fiscal years and cut price targets for D.R. Horton Inc. and KB Home, on the expectation of lower home orders and profit margins. Susan Maklari of Credit Suisse downgraded Lennar Corp. and Meritage to neutral from outperform, and KB Home to underperform from neutral…
Alan Ratner of Zelman & Associates warned investors to ‘buckle up for a rocky builder earnings season,’ citing downside risks for many metrics, especially orders.”
Interestingly enough, earnings reports last week finally garnered a different response from the market than the strong fades from the past several months. Pulte Home (PHM) is one of the most encouraging as the stock soared 7.7% post-earnings and faders failed to push the stock backward. PHM is still rallying in what looks like a bottoming pattern. PHM closed the week up 14.6% post-earnings, but it did not quite break out from its downtrend defined by the lower Bollinger Bands (BBs).
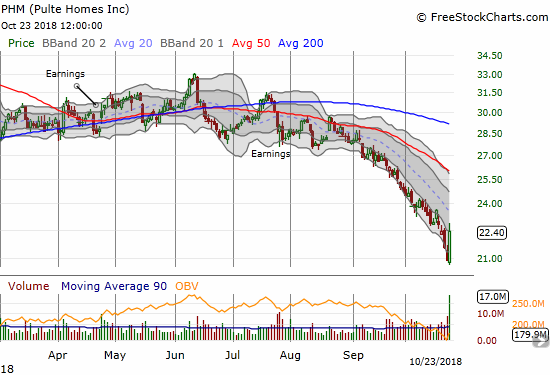
Pulte Home (PHM) bounced sharply off a 21-month low thanks to earnings. Downtrending 50DMA resistance still looms overhead.
Meritage Homes (MTH) put on its own display of fireworks with a 9.5% post-earnings gain on Thursday. The stock gained another 2.0% on Friday.
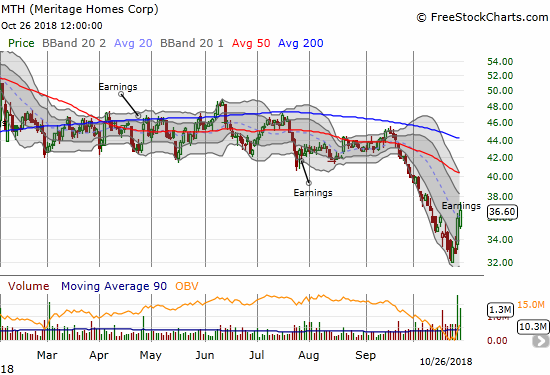
Meritage Homes (MTH) broke out of a steep downtrend from its lower Bollinger Bands (BBs) thanks to earnings.
The positive response to earnings was infectious as stocks like KB Home (KBH), Lennar (LEN), and Toll Brothers (TOL) managed to jump off lows and print mini breakouts.
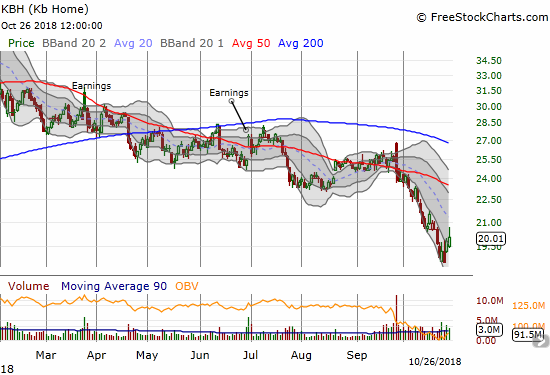
KB Home (KBH) traded above its lower Bollinger Band (BB) channel for the first time in over a month.
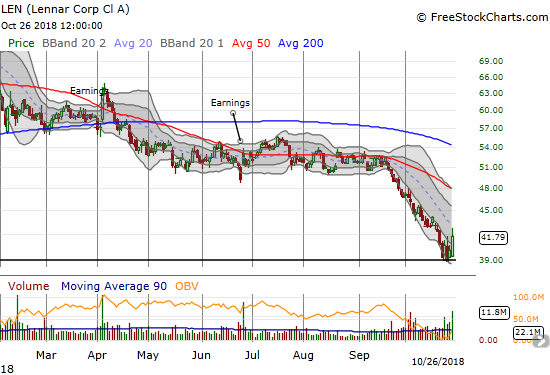
Lennar (LEN) experienced a surge in buying volume and ended the week above its downtrending lower Bollinger Bands (BBs).
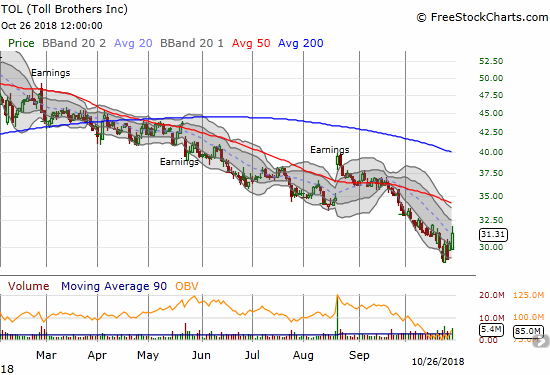
Toll Brothers (TOL) made a solid break for its downtrending 20DMA.
The bounces in home builders were all the more impressive in the face of heavy selling across the stock market. The relative out-performance is encouraging and is a good setup for the November to March period when ITB tends to out-perform the S&P 500 (SPY). Still, ITB itself did not quite breakout for the week, so the jury is still out as to whether this move is an overall bottoming or just a fleeting relief rally of short-covering and counter-trend bets and/or misplaced trades on “it cannot get much worse from here” sentiment.
New Residential Construction (Single-Family Housing Starts) – September, 2018
While housing starts surged in May and left no doubt that home builders were confident as ever, the subsequent plunge in housing starts in June appeared to temper that enthusiastic interpretation. Small increases from July through September seem to have stabilized things for now.
Single-family housing starts for August were revised significantly upward after two straight months of downward revisions from 862,000 to 879,000. September starts decreased month-over-month by 0.9% to 871,000. On an annual basis, single-family housing starts increased by 4.8%. This increase alleviates the weight of the previous three months which delivered two year-over-year declines. June’s year-over-year decline was the first for housing starts since August, 2016, and June’s level sits as the lowest of the year. I am still worrying that something important has fundamentally changed in the housing market. These data still look like a breakdown in slow motion with starts riding right at the edge of the post-recession uptrend.
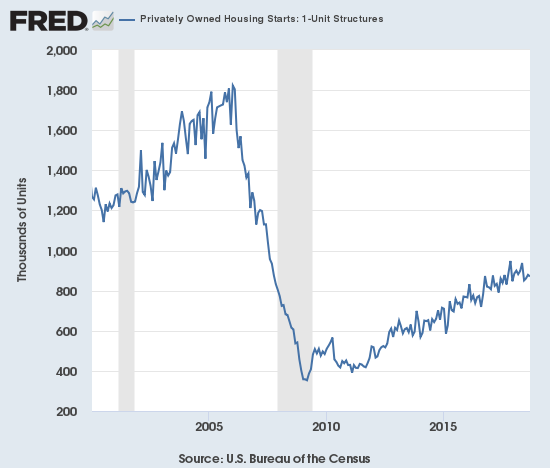
Another month with housing starts clinging to the bottom of recent lows.
Source: US. Bureau of the Census, Privately Owned Housing Starts: 1-Unit Structures [HOUST1F], retrieved from FRED, Federal Reserve Bank of St. Louis, September 24, 2018.
Over the 8 months prior to May, regional year-over-year changes in starts exhibited wide dispersion. For May, housing starts were very strong across the board. For July and August, the wide dispersion returned, and it continued in September. The Northeast, Midwest, South, and West each changed -25.3%, 3.2%, 7.6%, and 10.9% respectively. The bump up in July housing starts was less impressive than it appeared given it was mainly driven by the Midwest. For August, only a second month of gains for the West prevented housing starts from looking worse. Finally, in September, the regions delivered solid performances outside of the Northeast. Surprisingly, housing starts did not show the expected decline in September given damages from Hurricane Florence in southern states from Virginia to South Carolina.
Existing Home Sales – September, 2018
Existing home sales printed its fifth month-over-month decline over the last six months. Sales have declined year-over-year for the last 7 months. Last month, the National Association of Realtors (NAR) chose to celebrate headlines about a stabilization of sales and the end of the decline, but I countered with my skepticism. I think THIS month represents official acknowledgement of a sinking reality.
The path to red alert territory has been slow but noticeable. The February existing sales numbers ended a 2-month sales decline and softened a bit my alarm bells over slowing growth. In March, monthly sales continued to increase, but the year-over-year change was a decrease. For April, both monthly and year-over-year changes were declines. May recorded similar declines and put existing home sales right back in “yellow” cautionary territory. The June and July double whammies of monthly and annual declines put existing home sales in “red” territory. August’s continuation of year-over-year declines kept my mental indicator in the red. September delivered another double whammy of declines.
The seasonally adjusted annualized sales in September of 5.15M were down 3.4% month-over-month from the slightly downward revised 5.33M in sales for August. Year-over-year sales decreased 4.1%. Sales are down a whopping 7.4% year-over-year for the first 9 months of the year and are at their lowest level since November, 2015.
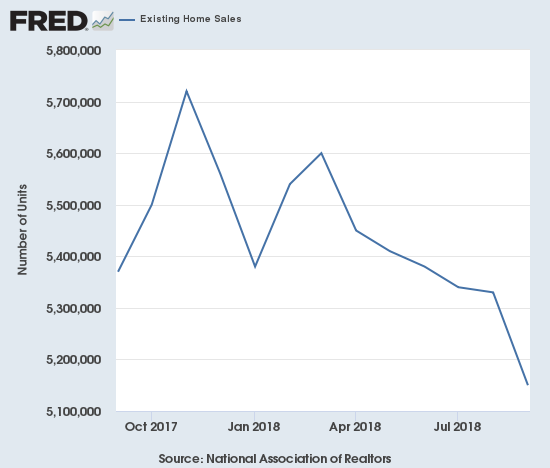
The topping pattern in existing home sales was confirmed with a new low in sales for the year.
(As of the March, 2018 data, the NAR further reduced historical data to just 13 months. For historical data from 1999 to 2014, click here. For historical data from 2014 to 2018, click here)
Source for chart: National Association of Realtors, Existing Home Sales© [EXHOSLUSM495S], retrieved from FRED, Federal Reserve Bank of St. Louis, October 27, 2018.
The routine description for existing sales is usually sales decline because of a shortage of inventory and sales increase in spite of inventory shortages. Sales have not increased for months, so the NAR has bounced around various themes attempting to put the declines in context. For August’s data, the NAR chose to emphasize a stabilization in sales after a few months of “drip drip” down (quote from the press conference). During October’s press conference, the NAR specifically used the term “soft data” to describe sales activity in terms of foot traffic in previously hot housing markets (from “strong to stable”). The NAR also directly blamed a 10-year high in mortgage rates for the sales slowdown.
Perhaps even more importantly, inventory is finally increasing and price appreciation is slowing as the NAR has long coveted, but these dynamics are not accompanied by increasing overall sales of existing homes. The NAR had to concede this time that there is “…without a doubt a clear shift in the market.” The NAR previously celebrated an increase in inventory as a return of buyers to the market; now, the NAR laments a decline in buyers.
The “cross-over” in June when inventory increased year-over-year for the first time since June, 2015 looks like the beginning of a trend. The 1.88M existing homes for sale is down 1.6% from August, but inventory is up 1.1% year-over-year. On a relative basis, inventory increased month-over-month and year-over-year. The 4.4 months of supply is a slight increase from August’s 4.3 and the 4.2 a year ago.
The share of sales going to first-time buyers continues to just bounce around. This month the share sat at 32%, an increase from 31% the previous month. This share was 32% in July, 31% in May and June, 33% in April, 30% in March, 29% in February and November was 33%. September, 2017 was the first time in the previous two years where the share dropped below 30% and has not dropped below since. The NAR took this opportunity to downplay the first-buyer share numbers: “Despite small month over month increases, the share of first-time buyers in the market continues to underwhelm because there are simply not enough listings in their price range.”
The average share for first-time homebuyers for 2016 was 35%. The NAR’s 2017 Profile of Home Buyers and Sellers reported an average of 34% for 2017. Investors purchased 13% of homes in August, the same as the last three months. Investor sales averaged a share of 15% in 2017 and 14% in 2016.
Existing home sales decreased across all four regions. Last month, the NAR’s focus on the month-over-month numbers did not tell the real story of continued decline. This time around the story of decline was unavoidable – the West’s third consecutive substantial drop is particularly concerning, especially given the size of the decline: Northeast -5.6%, Midwest -1.5%, South -0.5%, West -12.2% year-over-year. As usual, regional sale fluctuations had no relationship to the on-going price run-ups. The year-over-year price changes for September were again relatively robust: Northeast 4.1%, Midwest 1.9%, South 3.0%, West 4.1%. If not for the relatively steady first-time homebuyer numbers and on-going sales declines in the West, I would have assumed that higher-end homes are increasingly dominating existing home sales.
September’s 4.2% year-over-year increase in the overall median price of an existing home delivered the 79th consecutive month with a year-over-year increase. The median price of $258,100 is the third consecutive month-over-month decline. Given the sales declines, the NAR’s earlier optimism over four (now five) straight months of annual price gains below 5% is looking like a “watch what you wish for moment.”
Single-family sales were down on a monthly basis and decreased on a yearly basis by 4.0%. The median price of $260,500 was up 4.6% year-over-year.
New Residential Sales (Single-Family) – September, 2018
New home sales were resurgent in March. April sales did not keep pace on a monthly basis but delivered a strong year-over-year performance. In a surprisingly stark contrast to existing home sales, new home sales from May to August increased in each month on a year-over-year basis. September finally unleashed a “pent-up” decline in new home sales commensurate with existing home sales. This decline provided a final confirmation that November, 2017 delivered a substantial and sustained peak in new home sales.
The Census Bureau revised August sales of new single-family homes significantly downward from 629,000 to 585,000; five of the last six months have delivered sizable downward revisions – yet one more bad sign indicating a slowdown. August’s revision was steep but did still preserve a year-over-year gain for the month. New home sales for September decreased 5.5% month-over-month and sharply declined 13.2% year-over-year to 553,000. This decline was the largest since an April, 2011 26.5% year-over-year decline. It was the lowest level of new home sales since December, 2016 at 546,000 sales. Year-over-year gains regularly hit double digits starting in 2012; last November’s 26.6% jump was the highest since February, 2015 when new home sales soared 29.8% year-over-year. With August’s downward revision, 2018 has yet to deliver a double-digit year-over-year gain. September’s large drop sticks out as a sore confirmation that the trend in new home sales has fundamentally changed. Indeed, the graph below makes plain the significant and ominous trend-break.
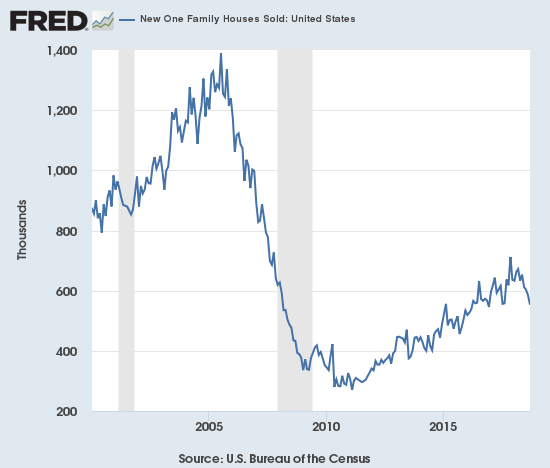
There goes the uptrend. September new home sales sliced right through the post-recession uptrend that has long supported the bullish thesis for new home sales.
Source: US. Bureau of the Census, New One Family Houses Sold: United States [HSN1F], retrieved from FRED, Federal Reserve Bank of St. Louis, October 27, 2018.
(This month I adjusted the discussion of inventory according to current revisions). In December, the inventory of new homes increased to 5.5 months of supply. A market for homes is in balance at 6 months of supply. March’s inventory stood at 5.3 months. For June, inventory jumped back up to 6.0 months of sales, a perfect balance. Inventory has continued to increase from there. September’s inventory surged to 7.1! In September’s Housing Market Review I wondered whether new homes might move too far to an over-supply condition; sure enough this is exactly what has happened. An over-supply of new homes detracts from the abiding optimism expressed by the NAR over higher supplies of existing homes. The swelling supply will also discourage builders from doing the kind of building the NAR wants to see.
May’s median price of $316,700 (revised) was an actual year-over-year decline. June delivered a second straight decline. July’s prices bounced back: the median price increased 1.6% (revised). August’s median price of $319,200 (revised) was also a year-over-year increase of 1.6%. With sales plunging in September it is no surprise that prices dropped year-over-year as well: the median declined 3.5%, the average declined 0.6%. These price declines sit in stark contrast to the persistent increase in price for existing homes.
The Northeast was a notable laggard for the third straight month with a whopping year-over-year sales decline of 51.3%. The Midwest was the only gainer at 4.1%. The South dropped 11.4%, and the West declined 15.8%. The Northeast has been extremely volatile for many months now. The Midwest continued a streak of multi-month growth. The declines in the West are now more closely aligning with languishing existing home sales in the West.
Home Builder Confidence: The Housing Market Index – October, 2018
In the April housing market review, I explained why I would not have thought much of March’s slight decline in the Housing Market Index (HMI). At 70, the HMI was still higher than it was for most of 2017. For July, the HMI stayed at 68 for the second straight month. However, the HMI dropped another point in August and stayed at 67 for September. For two straight months, the NAHB cleverly called 67 a “solid reading.” I was circumspect about this reading given it was the low for 2018, and I remain so even with the HMI increasing by one point in October. The following quote tells me that the NAHB sees a housing slowdown has begun (emphasis mine):
“Favorable economic conditions and demographic tailwinds should continue to support demand, but housing affordability has become a challenge due to ongoing price and interest rate increases. Unless housing affordability stabilizes, the market risks losing additional momentum as we head into 2019.”
Like the aggregate HMI, the components of HMI jumped slightly off recent lows. Two factors previously allayed alarm over the recent low HMIs: 1) in 2017 the HMI was also slipping to a low around September (September, 2017 was the nadir for last year at 64), 2) the (now) 68.9 average HMI for 2018 is still higher than 2017’s average of 67.8. September’s bounce needs to continue from here, but a strong bounce is not likely given the breakdown in new home sales.
The statement from the NAHB in May was very positive with a big caveat for rising prices. For June, the NAHB made an even bigger issue of lumber prices by shining a spotlight on trade actions that drove those prices higher. For August, the NAHB singled out the drivers of poor affordability. The September statement was one of the stranger ones I have seen from the NAHB. The NAHB finally acknowledged the decline in lumber prices but seemed eager to increase the spotlight on other drivers of poor affordability: “…builders still need to manage construction costs to keep homes competitively priced. Wages and subcontractor payments continue to rise as the labor market for residential construction sector remains tight.” The NAHB later went on to suggest that trade problems are still driving material costs higher: “housing affordability is becoming a challenge, as builders face overly burdensome regulations and rising material costs exacerbated by an escalating trade skirmish.” For October, the NAHB acknowledged a 3-month decline in lumber prices, but warned about unspecified “supply side costs” still threatening the affordability of homes.
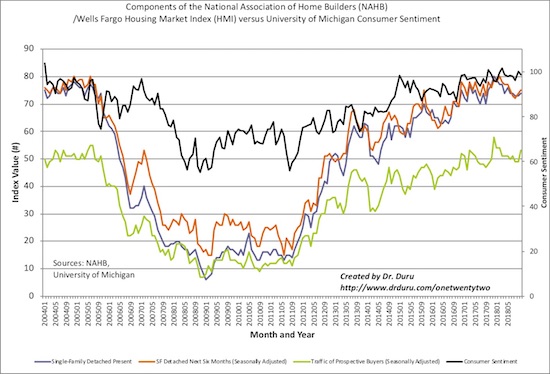
Consumer confidence remains stalled out while the components of the HMI lifted a bit off recent lows.
Source: NAHB
As a whole, the regional HMIs confirm the languishing nature of recent HMIs, but each region “woke up” a bit in October. The Northeast continued a recovery with a 4 point gain to 64. The Midwest ended a 4-month losing streak and bounced off a 2-year low with a 2-point gain to 58. The South gained 2 points to 71. The West gained a point to 75.
Needless to say, home builder sentiment will be a key tell in the coming months. In the last Housing Market Review, I concluded that HMI had to begin a recovery in October for me to look forward more optimistically to the seasonally strong period for home builder stocks (November through March/April). With HMI just a point off its low, home builder sentiment still looks like a breakdown in slow motion.
Parting thoughts
I was immediately skeptical of the 2013 book “The End of the Suburbs: Where the American Dream Is Moving” by Leigh Gallagher. It was published in the immediate wake of the disruptive forces unleashed by the housing bust, and it seemed too quick to come to conclusions about fundamental changes in the housing preferences of Americans. Work done by economist Jed Kolko suggests that my early skepticism was likely on point. He used Census data to show that as of 2016, Millennials have been moving BACK to the suburbs.
Millennials, to the suburbs!
— Jed Kolko (@JedKolko) June 22, 2017
(New @uscensusbureau population estimates for counties, 2016.) pic.twitter.com/ykSHzOSuQj
Kolko provides extensive demographic detail in “2016 Population: Back to the Suburbs, Back to the Past.” I am not surprised by these findings, primarily because city living has become so incredibly expensive in so many metro areas. It will be interesting to see how a housing slowdown alters these dynamics.
Be careful out there!
Disclosure: I am long ITB calls and calendar spread.
Follow Dr. Duru’s commentary on financial markets via more


