
Housing Market Review – Just Another Month (July, 2017)
The last Housing Market Review covered data reported in June, 2017 for May, 2017. The month from there was relatively sedate for home builders. For example, the iShares U.S. Home Construction ETF (ITB) went absolutely nowhere with August’s burst out the gate providing a bit of a gain. The good news is that the uptrend defined by the 50-day moving average (DMA) remains intact. The month was one of those validations of my decisions to switch to a monthly cadence for reporting on housing data: chasing the latest data point can cause far much more volatility in analysis than is necessary.
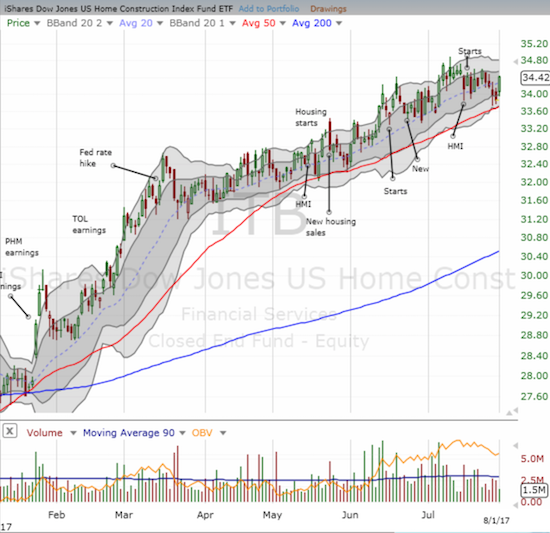
The iShares U.S. Home Construction ETF bounced sharply to start trading in August in a move that may have confirmed support at the 50-day moving average (DMA).
Source: FreeStockCharts.com
The key highlight of the month for me was the strong one-day reaction to housing starts and new home sales that continued to impress. Toll Brothers (TOL) almost became a low-light. I found myself at the edge of selling and locking in my profits. Fortunately I waited one day to see whether the market confirmed a breakdown below the uptrending 50-day moving average (DMA). The following day, TOL bounced sharply along with the rest of the home builder group.
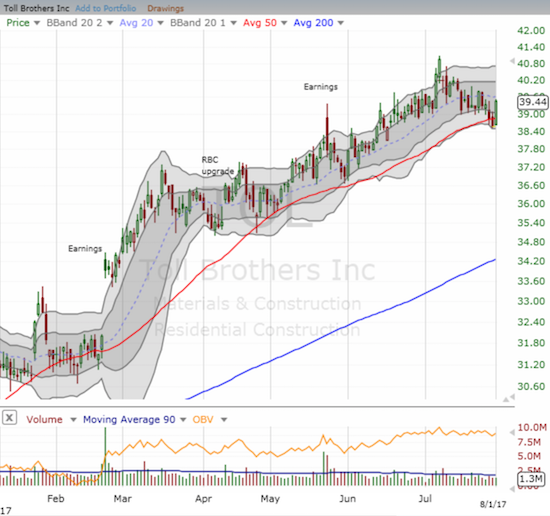
Toll Brothers bounced its way out of a 50DMA breakdown. The stock’s 50DMA uptrend now remains intact, but TOL must still break the downtrend from the recent high.
An imminent low-light comes in the form of the call options I bought on KBH Home (KBH). Despite my general ban on buying home builders in the “off-season” absent a significant sell-off, I decided to try to profit off continued momentum. KBH is up an incredible 47% year-to-date, but my call options will likely expire this month with little to no value given KBH’s failure to continue its 2017 run-up.
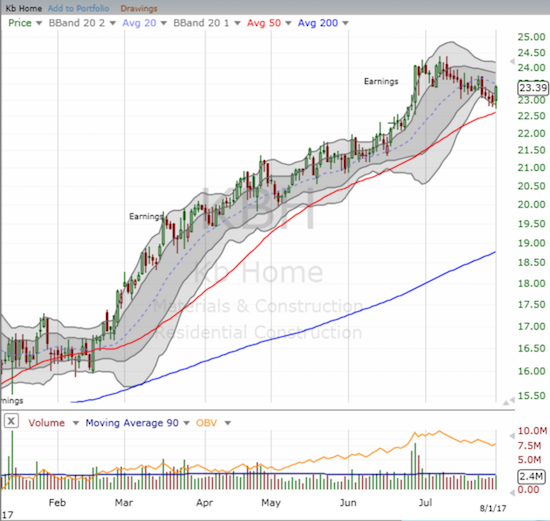
KB Home is up an incredible 47.9% year-to-date
Overall, the housing data for the latest month was solid but not exciting enough to hold the attention of buyers. The end of the Spring selling season heightens the hurdle of interest – unless of course the news happens to be bad.
New Residential Construction (Housing Starts) – June, 2017
After three months of monthly declines, housing starts finally increased. The market reaction immediately reversed the losses on ITB from the surprisingly strong pullback in the wake of the HMI decline (see below). I was reminded that the market is always searching for a reason to dump housing stocks, especially after the seasonally strong Spring selling season.
Single-family housing starts for May were revised upward from 794,000 to 799,000. June starts increased month-over-month by 6.3% to 849,000. This change reaffirmed the on-going uptrend, and it wiped away a good deal of the previous three month’s losses. On an annual basis, single-family housing starts increased a healthy 10.3%. This gain exceeded the previous three months of year-over-year gains. The previous year-over-year increases were 11.1% in January, 13.5% in February, and 9.3% in March, 8.8% in April, and 8.5% in May.
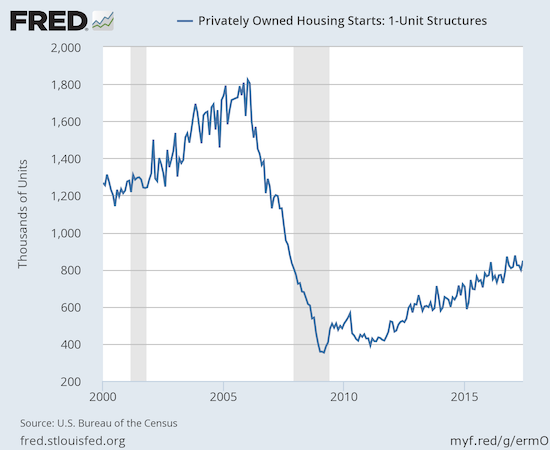
Single family housing starts jump in June and reaffirm the uptrend.
Source: US. Bureau of the Census, Privately Owned Housing Starts: 1-Unit Structures [HOUST1F], retrieved from FRED, Federal Reserve Bank of St. Louis, July 19, 2017.
After three months of wide deviations, the regional changes were more uniform for June. The Midwest, South, and West each jumped 17.5%, 8.5%, and 22.4% respectively. The Northeast cooled for a third month in a row this time with a whopping 19.2% decrease. The West has logged two months in a row of 22% annual gains. Looks like the market has heated up to finally deliver more housing to a very constrained marketplace (see below for similarly hot new home sales in the West).
Existing Home Sales – June, 2017
By now, regular readers should know the routine with the report on existing sales: sales decline because of a shortage of inventory and sales increase in spite of inventory shortages. For June, 2017, sales declined.
For January 2017, existing home sales hit levels not seen since February, 2007. For February 2017, existing home sales dropped sharply from the previous month’s post-recession high and served up a reminder of the month-to-month volatility in this series. For March, existing home sales made a sharp rebound and set a new post-recession high (the highest in over 10 years). For April, the yo-yo dropped down slightly, in May it bounced up slightly, and in June it dropped down slightly again. On cue, the NAR switched to explaining the down-tick in sales but at least this time the NAR duly noted the year-over-year increase:
“Closings were down in most of the country last month because interested buyers are being tripped up by supply that remains stuck at a meager level and price growth that’s straining their budget…The good news is that sales are still running slightly above last year’s pace despite these persistent market challenges.”
The seasonally adjusted annualized sales of 5.52M were down 1.8% month-over-month from 5.62M in sales for May (the revision resulted in no change). Year-over-year sales still increased 0.7% (compare to November’s 15.4% year-over-year pop, December’s 0.7% increase, January’s 3.8% rise, February’s 5.4% increase, March’s 5.9% gain, April’s 1.6% increase, and May’s 2.7% increase). February sales dropped to levels last seen September, 2016 while March sales jumped to levels last seen February, 2007. April, May, and June sales seem to indicate levels will stay around 10-year highs for a while although one could reasonably argue that the recent uptrend remains well in place. Such an uptrend still needs confirmation in the next few months with a new high.
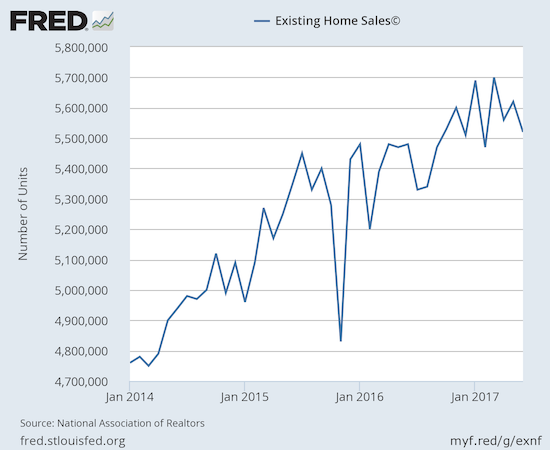
Existing home sales seem content to bounce along new 10-year highs.
(recall that the NAR no longer makes data available before 2013. For more historical data to 1999 click here)
Source: National Association of Realtors, Existing Home Sales© [EXHOSLUSM495S], retrieved from FRED, Federal Reserve Bank of St. Louis, June 26, 2017.
First-time buyers dropped ever so slightly from May’s 33% to June’s 32% of sales. This share has essentially been stuck in the low 30s all year. The average for 2016 was 35%. I am not surprised that the NAR lamented:
“It’s shaping up to be another year of below average sales to first-time buyers despite a healthy economy that continues to create jobs,” said Yun. “Worsening supply and affordability conditions in many markets have unfortunately put a temporary hold on many aspiring buyers’ dreams of owning a home this year.”
The absolute level of inventory of existing homes has fallen year-over-year for 25 straight months. Recall that during the June press conference, the NAR talked about a housing crisis in supply in some housing markets. The 1.96M homes for sale represented a 7.1% decrease from the previous June. The recent year-over-year declines have been remarkable: August -10.1%, September -6.8%, October -4.3%, November -9.3%, December -6.3%, January -7.1%, February -6.4%, March -6.6%, April -9.0%, and May -8.4%. This translates into markets where homes do not stay on the market for long:
“Properties typically stayed on the market for 28 days in June, which is up from 27 days in May but down from 34 days a year ago.”
The 27 days of inventory in May was the lowest level since the NAR started tracking these data in May 2011. In December, inventory hit a new absolute low measured from 1999 when the NAR began tracking. For June, inventory decreased (0.5%) after five consecutive months of month-over-month increases. At 4.3 months of sales, relative inventory increased from May’s 4.2 months but was down from the 4.6 months a year ago. In December, inventory was at 3.6 months of sales. Inventory levels apparently responded slightly for the Spring selling season – a small positive sign that the NAR never acknowledged.
Investors purchased 13% of existing homes in June, down from the 16% in May. A year ago, investors bought 13% of existing homes for sale. Even with this return to the lower levels of a year ago, investor appetite is clearly not satiated.
For June, no region experienced a year-over-year decline in existing home sales: Northeast 1.3%, Midwest 0%, South 0%, West 2.5%. All regions logged year-over-year price jumps, all of them substantial: Northeast 4.1%, Midwest 7.7%, South 6.2%, West 7.4%. The price surges in the South and West make the strong annual sales increases in recent months in those regions even more impressive given the NAR has a habit of blaming high prices for lower sales in the national numbers.
June’s 6.5% year-over-year increase in the overall median price of an existing home represents the 64th consecutive month of year-over-year increases. The median price of $263,800 set a new record that leapt over the previous record set just in May of $252,800. This latest jump officially voids my expectation for a year-over-year price drop by June, 2017. The NAR appeared startled by the surge in May and issued an alarm. That alarm must be growing as the NAR used the press conference to dismiss the notion of a housing bubble. Inflation-adjusted prices are still 9% below the 2006 housing bubble peak. Moreover, lending standards remain extremely strict and housing starts are still running about half the pace of the bubble.
Single-family sales decreased on a monthly basis (2.0%) and increased on a yearly basis by 0.6%. The median price of $266,200 is the fourth monthly increase after a string of monthly declines. The median price was up 6.6% year-over-year, slightly above May’s 6.0% and April’s 6.1% year-over year gains.
“Single-family home sales dipped 2.0 percent to a seasonally adjusted annual rate of 4.88 million in June from 4.98 million in May, but are still 0.6 percent above the 4.85 million pace a year ago. The median existing single-family home price was $266,200 in June, up 6.6 percent from June 2016.”
New Residential Sales – June, 2017
Gains in new single-family home sales for May cooled down the near panic over the three straight months of decline in housing construction. News sales performed well year-over-year again.
The Census Bureau revised May sales of new single-family homes slightly downward from 610,000 to 605,000. New home sales for June increased 0.8% month-over-month and 9.1% year-over-year. The annual percentage gain was slightly higher than May’s 8.9%. This produced a convincing continuation of the on-going uptrend.
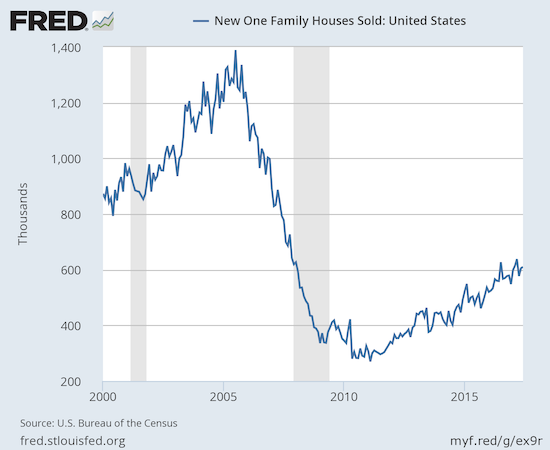
Becoming routine: single-family new home sales continue trending upward from the trough of the housing collapse.
Source: US. Bureau of the Census, New One Family Houses Sold: United States [HSN1F], retrieved from FRED, Federal Reserve Bank of St. Louis, July 30, 2017.
New home inventory increased from 5.3 to 5.4 months of supply. This level continues to sit in (surprisingly) sharp contrast with the much more scarce inventory of existing homes. A market for homes is in balance at 6 months of supply.
New home sales yet again exhibited a large range of year-over-year changes across regions. The Midwest had an impressive 3-month streak until May delivered a 23.6% year-over-year decline. The double digit declines continued with a 12.0% year-over-year drop in June. The South barely skated by in positive territory with a 0.9% year-over-year gain. The Northeast and the West shone brightly with whopping 41.4% and 33.3% year-over-year surges. Hard to believe I put the West on my “radar of caution” just two months ago!
After May’s notable changes in the distribution of sales by sales price, I decided to watch more closely for trends in pricier homes. Homes priced from $200,000 to $299,000 bounced back while share in the pricier $300,000 to $399,000 and $400,000 to $499,000 ranges fell notably. It is good to see the sales in the median range bounce back as they represent the more typical home buyers and entry level families. Homes sold in the $500,000 to $749,000 range jumped back to 8% share which is a tie for the highest level in at least a year. I have to assume the surging sales in the expensive Western region are responsible for this increase. Overall, these changes in share mean there is not yet some new trend toward pricier homes.
Home Builder Confidence: The Housing Market Index– July, 2017
In March, builder confidence soared to a new 12-year high at 71. The HMI now appears stalled just under that 12-year high. April dropped to 68, May increased just a point to 69, June dropped to an adjusted 66, and July dropped further to 64. I heard headlines making a big deal of this drop as an 8-month low yet when the HMI was this low back in December, it was a very high reading. Indeed, the National Association of Home Builders (NAHB) called the results for July “solid” and added that “The HMI measure of current sales conditions has been at 70 or higher for eight straight months, indicating strong demand for new homes.”
The NAHB’s stated concerns focused on the rising costs faced by builders:
“Our members are telling us they are growing increasingly concerned over rising material prices, particularly lumber…This is hurting housing affordability even as consumer interest in the new-home market remains strong…
…builders will need to manage some increasing supply-side costs to keep home prices competitive.”
I think this piles on top of the concerns stated in the June HMI:
“As the housing market strengthens and more buyers enter the market, builders continue to express their frustration over an ongoing shortage of skilled labor and buildable lots that is impeding stronger growth in the single-family sector.”
Still, my earlier expectation for a new post-recession high at some point this year is fading as it is now looking like it will take the anticipation of a strong Spring selling season to perk HMI back to those highs. In the meantime, the three components of HMI look like they have leveled off from recent highs.
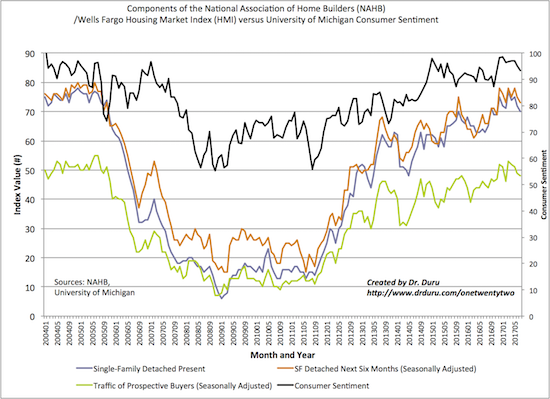
All the components of the Housing Market Index (HMI) show sentiment has cooled off from the recent multi-year high along with a slightly cooling in red hot consumer sentiment.
Source: NAHB
For May and June, there was an interesting disparity in the regional changes in HMI. In May, the West finally broke out from the flatline of the previous 4 months with a 80 reading. However, the West plunged in June back to 71 to a near 1-year low. This month, the West increased to 74 and joined the Northeast with a month-over-month increase. The West is off watch for sentiment given its relative out-performance. Sentiment in the Midwest and the South dropped significantly by 4 and 5 points respectively.
Parting thoughts
While home builders have generally held up well, Home Depot (HD) has run into troubles that look (short-term) bearish. After reporting earnings in May, HD gapped up higher but sold off from there: aka a “gap and crap.” The bearish significance of this topping pattern appeared when a brief rally in June failed underneath the intraday all-time high set by the post-earnings reaction. The market’s wariness really showed up in the speed and eagerness of the sellers in the aftermath of an Amazon Panic over a deal with Sears to sell Kenmore appliances. HD’s 50DMA is now turning downward and looks setup to provide stiff overhead resistance.
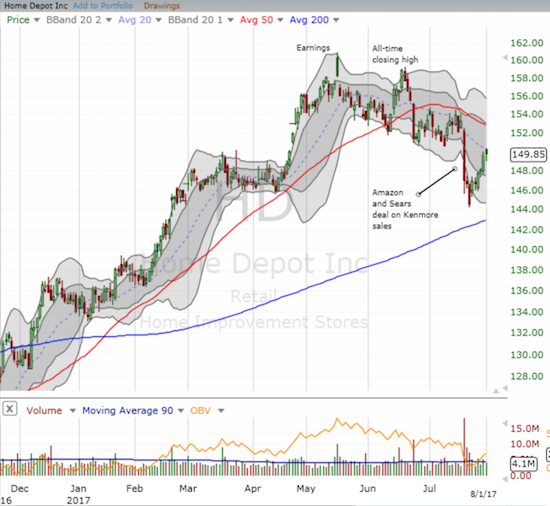
Home Depot (HD) printed an ominous and bearish “gap and crap” after reporting May earnings. That top (at an all-time high) was confirmed when June’s rally failed to hold right before the intra-day all-time high.
Source: FreeStockCharts.com
While the zoom-in looks bearish, the longer-term chart makes the current turmoil look like a blip on the map. HD has had an impressive run, so the current troubles are for now just a concern for short-term trades. I will be paying more attention than usual to HD’s earnings next week on August 15th.
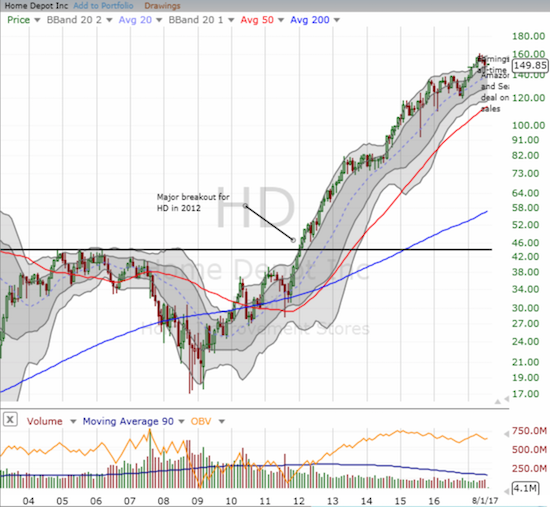
Home Depot is up 231% just from 2012’s major breakout.
Source: FreeStockCharts.com
Note that Lowe’s (LOW) has long under-performed HD. However, surprisingly enough, LOW has already overcome the Amazon Panic and what looked like at the time a major breakdown below 200DMA support. LOW is now fighting with resistance at its downtrending 50DMA.
These mega hardware stores are important (partial) barometers for household formation and first-time homebuyers.
Macro-housing issues have also recaptured my attention. In particular, the issue of housing affordability has become acute enough to impact the quality of life for a growing number of people. I daresay housing affordability could impede economic growth or at least put pressure on the margins of home builders. While I do not have time to discuss in detail here, I am offer up related material for the reader’s review:
- “The Cost of a Hot Economy in California: A Severe Housing Crisis” (July 17, 2017) – The New York Times.
- “Spiral of Losses: The story of one family fighting to hold on to their home in one of America’s toughest housing markets” (July 19, 2017) – KQED’s Q’d Up. This podcast/article included a discussion about how corporations like Colony Starwood Homes, now Starwood Waypoint Homes, (SFR) have come to dominate the market for rental homes with sometimes devastating effect. SFR’s biggest markets are in Atlanta and Los Angeles. Aaron Glantz has written several revealing articles on SFR and corporate landlords.
- On a related topic, Fannie Mae Research looked at the trend that has converted significant portions of the stock of starter homes into the rental market. See “Many Starter Homes Have Shifted from Owner-Occupancy to Rentals.” Here is a key quote:
“As single-family investors swooped into the market in the wake of the housing bust and converted homes from owner- to renter-occupancy, they helped to stabilize prices, remove excess vacant units from the market, and absorb a bloated inventory of foreclosed homes. While serving these important functions, they have also contributed to the starter-home shortage that now appears to be slowing the return of first-time buyers to the housing market.”
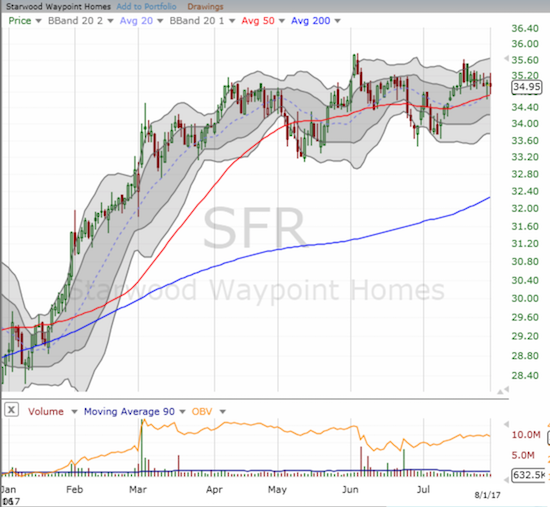
Starwood Waypoint Homes is up a heft 21.3% year-to-date.
Source: FreeStockCharts.com
Disclosure: long TOL, long KBH call options
Follow Dr. Duru’s commentary on financial markets via more


