
Gold's Upside Target For December 2017
In our Monday’s analysis, we emphasized that a lot changed from the short-term point of view, even though price changes in gold and silver were small. On Tuesday, we argued that closing our short position on Tuesday had been justified. Mining stocks soared by over 3% making yesterday’s session the biggest daily rally since August. A lot has changed indeed. Will the rally continue for much longer?
Let’s take a look at the chart to find out, starting with the chart that was the first to indicate that the decline is ending – platinum (charts courtesy of StockCharts).
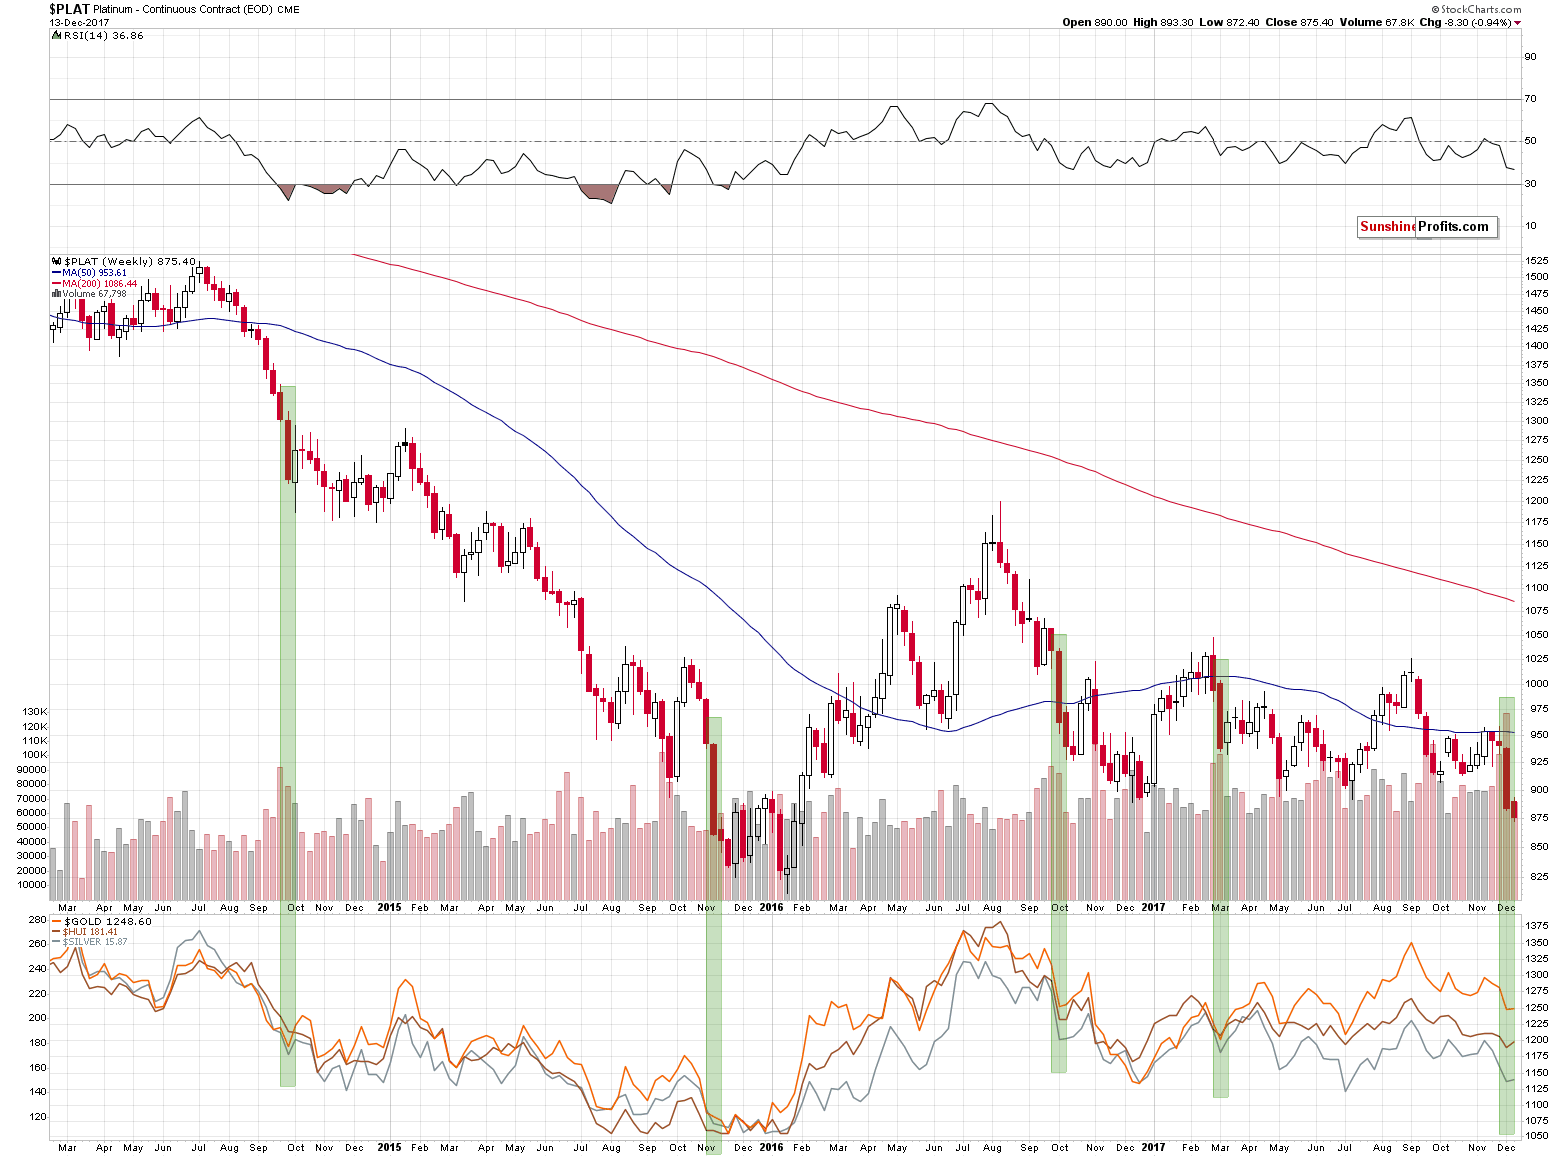
On Monday, we wrote the following based on the previous week’s price changes in platinum:
As odd as it may sound, whenever platinum declined in a very profound way (about 5% in a week), it meant that either a corrective upswing was about to start in the following week (2014, 2016) or that a decline had just ended (2015, March 2017). We’ve seen this phenomenon 4 times in the recent years and in each case, it had bullish implications. 4 out of 4, meaning 100% efficiency is not something that should be ignored.
Does it mean that the precious metals sector will soar immediately? No. The above chart is based on weekly candlesticks in the case of platinum and weekly closing prices in the case of gold, silver and the HUI Index that are visible in the lower part of the above chart. Consequently, whatever implications the above chart has, they are in terms of the next week’s closing prices. So, gold, silver and mining stock are likely to end the next week higher, but not necessarily rally in its first part.
We previously mentioned that the Fed interest rate decision day could mark a turning point or we could see the interim bottom very close to it. The above chart supports this outlook and it suggests that we should be prepared to either exit the short positions or to switch to long ones. We are considering both options and which decision we take will depend on the confirmations that we get in the meantime.
The above does not only tell us that the precious metals market was about to bottom (we can already see that it did), but it also shows what kind of move we can expect.
Back in September 2014, gold rallied about $50, in 2016 it soared by about $80 (but about $50 in terms of weekly closing prices) and earlier this year gold moved higher by about $90. The 2015 bottom resulted in much bigger temporary gains.
The difference between the above cases is quite significant. The reason could be that in two cases, the big weekly decline in platinum took place during bigger declines and in two cases it took place either at the end of the big decline or within a bigger rally.
Since there are multiple reasons to believe that the precious metals sector is in a bigger decline, it seems that we should focus on the analogy to the 2014 and 2016 analogies.
As we wrote earlier, in the first case gold rallied about $65 in terms of intraday highs and about $50 in weekly closing prices. In the second case, it rallied by $80 or $50, using analogous measures. What does it tell us? It gives a hint that gold is likely to rally $50 - $80 from the bottom and that the lower part of this range is more likely.
But, before moving further, let’s consider how much we can trust the above technique, given that there are only two very similar cases. Based on our experience, it seems that we should use it as a general guideline only. In other words, it makes us think that the upswing is not a one-day event, but also that it’s not something that is about to trigger a $100+ rally. In other words, we plan to use it as a confirmation of other techniques rather than a tool for setting the profit-take levels for our current long trading positions.
Ok, so how high can gold rally then?
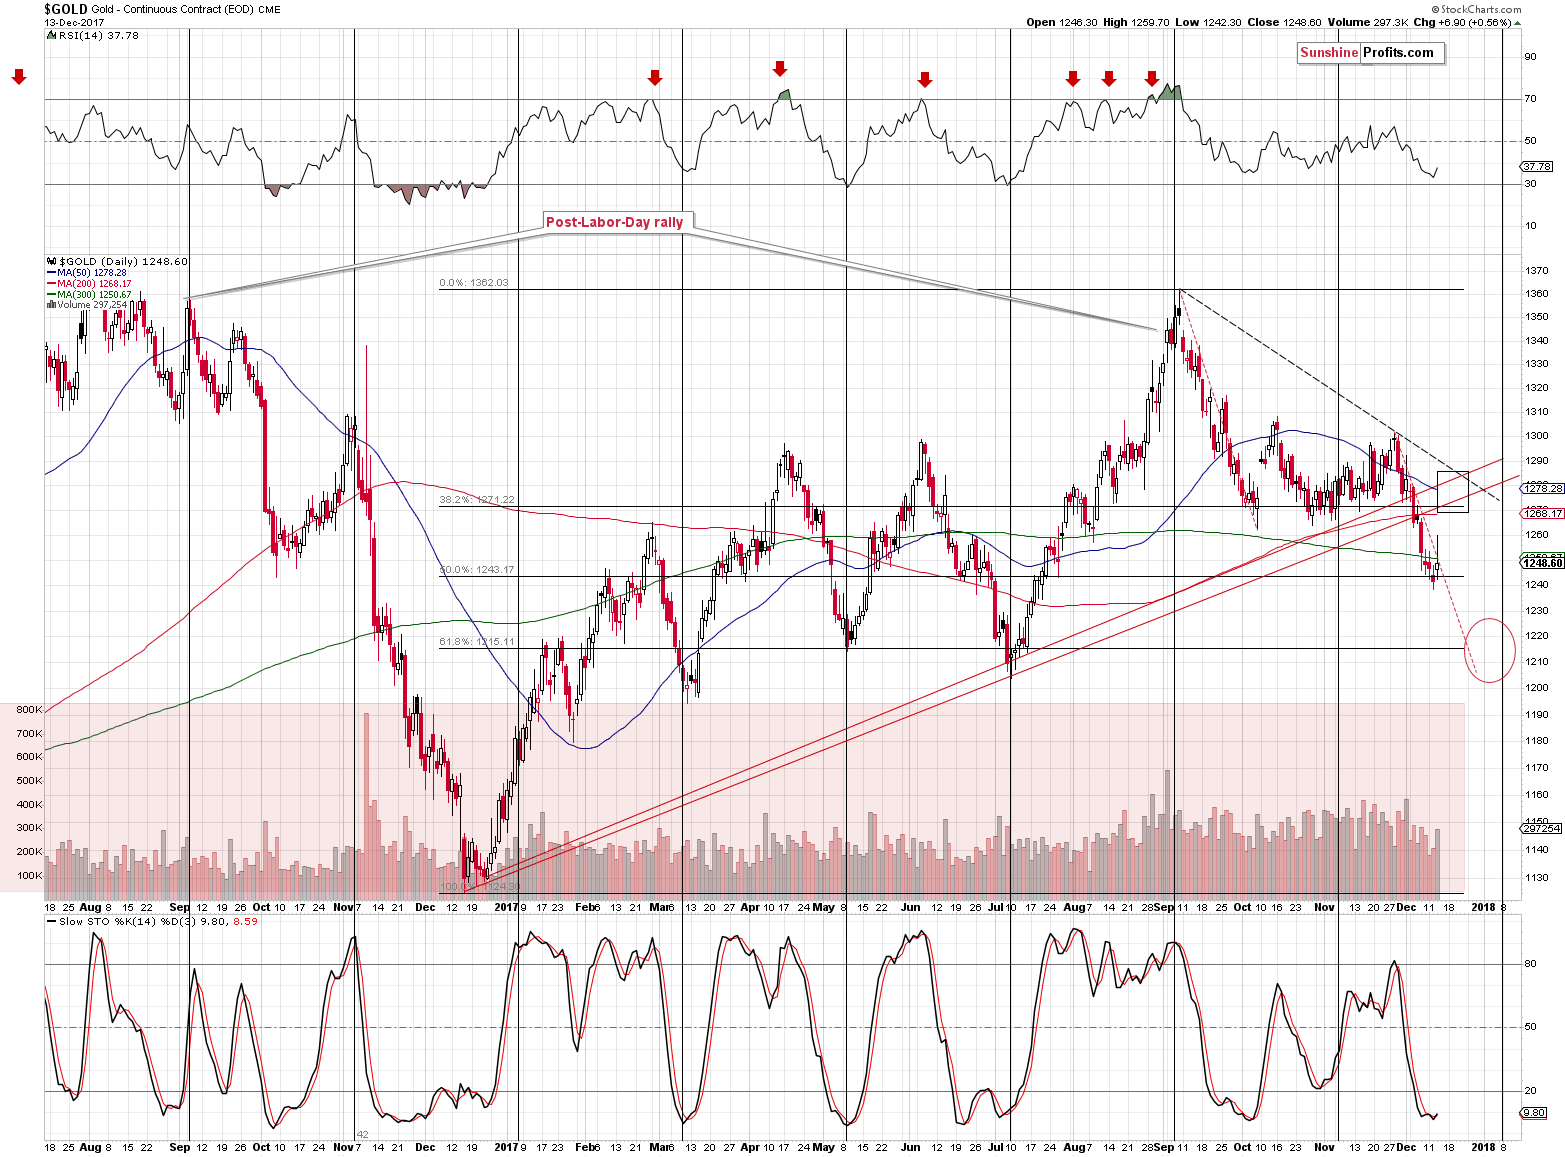
To $1,270 - $1,290. That’s the target price range that includes most of the nearby resistance levels: the October and November lows in terms of the closing prices, the rising red support lines that were recently broken, the declining dashed resistance line, and the 50-day moving average.
The interesting thing about the 50-day MA is that the last two times when the price of gold moved to it, it actually broke it insignificantly and then started another downswing. If the history is to rhyme, we’re likely to see gold temporarily above $1,280 and then another slide.
The volume during yesterday’s upswing was sizable, which confirms the bullish outlook. The price change that’s visible on the above chart is likely incorrect – gold ended the session without the reversal that the above chart shows (and at the moment of writing these words, gold is trading at $1,257).
Summing up, the medium-term outlook for the precious metals market didn’t change based on this and last week’s developments and it remains bearish, but the short-term outlook improved significantly. Gold is likely to rally for additional $15 - $35 or so, before turning south again. Silver, mining stocks, and related leveraged ETFs are also likely to move higher, but we’ll keep details regarding these targets.
Disclaimer: All essays, research, and information found on the Website represent the analyses and opinions of Mr. Radomski and Sunshine Profits' associates only. As such, it may prove wrong ...
more

