
Futures Posiitions Of Non-Commercials; Commitment Of Traders For This Week
Following futures positions of non-commercials are as of July 31, 2018.
10-year note: Currently net short 590.1k, up 80.6k.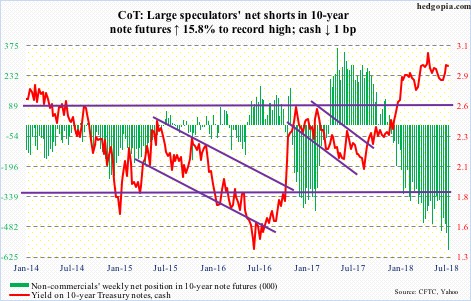
The first paragraph of this week’s FOMC statement contains the word “strong” twice and “strongly” once in describing the economy. This is as clear a signal as any that a hike is coming in September. Markets expect one. In the futures market, September odds of a hike are 94 percent. Nearly a lock. December odds are 68 percent. If the Fed moves in both these meetings, by the end of the year the fed funds rate will be in a range of 2.25 percent to 2.5 percent.
The Fed has a dual mandate – price stability and maximum employment. Core PCE – the bank’s favorite measure of consumer inflation – rose 1.9 percent in the 12 months through June. The Fed has a two-percent goal on inflation. The last time core PCE rose with a two handle was in April 2012. In the meantime, the unemployment rate in May dropped to 3.8 percent (July was 3.9 percent), which was the lowest since 3.5 percent in December 1969.
Markets are focused on inflation, which despite nine years of economic recovery remains subdued. The Jerome Powell Fed is beginning to focus on the other side of the coin. Post-financial crisis, rates were pushed to the zero bound and left there until December 2015. Since then, the fed funds rate has gone up by 175 basis points to a range of 175 to 200 basis points, which is still accommodative. Two more hikes, and this can begin to change, particularly considering the amount of leverage in the system.
Hikes in September and December means rates will be north of core PCE. The persistently narrowing yield curve is probably trying to foretell something. In the event of a downturn in the economy, the Fed’s monetary quiver does not have sufficient arrows. The FOMC dot plot shows members want to move three more times next year. Markets are currently ready for one. A battle lies ahead.
30-year bond: Currently net short 20.6k, down 23k.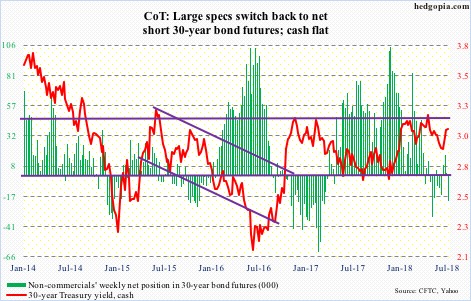
Major economic releases next week are as follows.
Tuesday has June’s JOLTS on tap. Job openings in May fell 202,000 month-over-month, but April’s 6.84 million was the highest ever.
PPI (July) is out Thursday. Producer prices for final demand climbed 0.3 percent m/m in June. In the 12 months to June, prices rose 3.4 percent. Over the same time frame, core PPI increased 0.3 percent and 2.7 percent respectively.
CPI (July) comes out Friday. Consumer prices rose 0.1 percent m/m and 2.9 percent on an annual basis. Core CPI rose 2.9 percent m/m and 2.3 percent year-over-year.
Crude oil: Currently net long 652.6k, down 4.2k.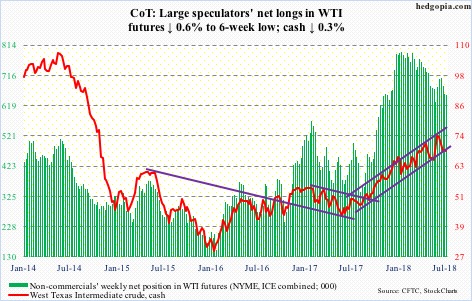
Spot West Texas Intermediate crude ($68.49/barrel) continues to go back and forth around the 50-day moving average. Oil bulls once again defended support at $66-67, but at the same time they were not able to take out resistance at $69-69.50. The crude has lost a rising trend line from June last year – although only slightly. Bulls will have their hands full if bears start showing up at the underside of that broken line.
In the week to July 27, the EIA report showed crude stocks jumped 3.8 million barrels to 408.7 million barrels. The prior week was the lowest since February 2015. Distillate stocks rose too, up three million barrels to 124.2 million barrels.
Gasoline stocks dropped 2.5 million barrels to 231 million barrels. Crude imports fell 21,000 barrels per day to 7.75 million b/d. Crude production declined 100,000 b/d to 10.9 mb/d. Refinery utilization increased 2.3 percentage points to 96.1 percent.
E-mini S&P 500: Currently net long 170.3k, down 11.6k.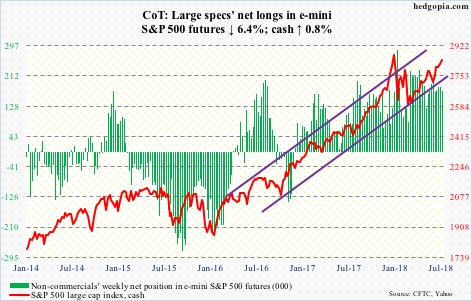
Bulls stepped up where they needed to. Early weakness Thursday morning was bought hand over fist just under 2800. The cash (2840.35) broke out of this level mid-July. Wednesday last week, it retreated after getting rejected at the upper bound of a four-month rising channel at 2848.03. This price point is now worth watching next week.
In the week to Wednesday, flows improved as well. US-based equity funds (including ETFs) gained $2.1 billion (courtesy of Lipper.com). In the ETF land, SPY (SPDR S&P 500 ETF) took in $4.6 billion, VOO (Vanguard S&P 500 ETF) $145 million, while IVV (iShares core S&P 500 ETF) lost $662 million (courtesy of ETF.com).
Euro: Currently net long 22.8k, down 6.8k.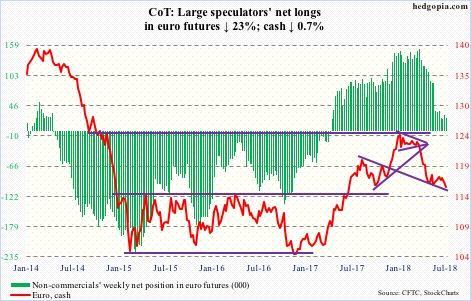
Resistance at $117.40-ish once again proved tough. Tuesday, the cash ($115.75) rose to $117.47 before sellers came out of the woodwork, pushing it – once again – below the 50-day. Support at $114-115 is being tested again. The first time the euro dropped to that support was nine weeks ago – in late May. After going sideways in a rectangle for nearly two and a half years, the currency broke out of this level in July last year. This is a must-hold.
The euro peaked at $125.37 late January. Sideways action after the drop it sustained since that peak is not bad, but bulls are taking too long to rally off of this support.
Gold: Currently net long 35.3k, down 13.3k.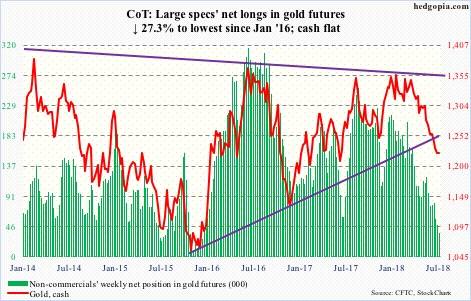
Since dropping to an intraday low of $1,210.70/ounce on July 19, the cash ($1,223.20) has gone sideways, with near-term resistance at $1,235. Tuesday, the metal retreated after hitting an intraday high of $1,237.80.
It seems buyers are on strike to see if gold bugs get their act together and take out that resistance or if the recent low gets breached. Gold has already lost a rising trend line from December 2015.
The listless action can be seen in how flows into GLD (SPDR gold ETF) and IAU (iShares gold trust) are behaving. In the week through Wednesday, after no activity in the first four, Wednesday saw GLD bleed $127 million. IAU has seen no activity in the last nine (courtesy of ETF.com).
In the meantime, non-commercials continue to reduce net longs. Despite this, the cash – flat for the week – held its ground.
Nasdaq 100 index (mini): Currently net long 43.2k, up 10.4k.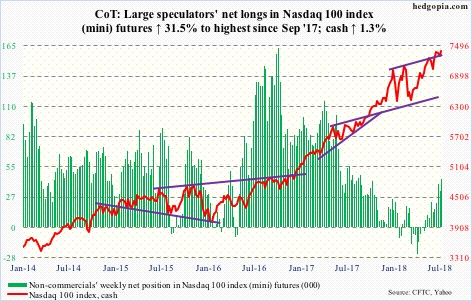
Apple (AAPL) literally saved the day for the Nasdaq 100 – for now. Monday and Tuesday, the cash (7395.49) tested the 50-day. Tuesday, AAPL reported its fiscal 3Q, followed by a 5.9-percent jump Wednesday and another 2.9-percent rally Thursday. The stock has a 12-percent weight in the index. For the week, the Nasdaq 100 rallied 1.3 percent, and has room to go test last week’s high, which is 1.6 percent away. Things are different on a weekly basis, however, where momentum indicators remain way overbought, and are looking ready to head lower.
In the week to Wednesday, QQQ (PowerShares QQQ ETF) saw $765 million come out (courtesy of ETF.com). In the prior week, $1.6 billion was withdrawn.
Russell 2000 mini-index: Currently net long 32.8k, up 7k.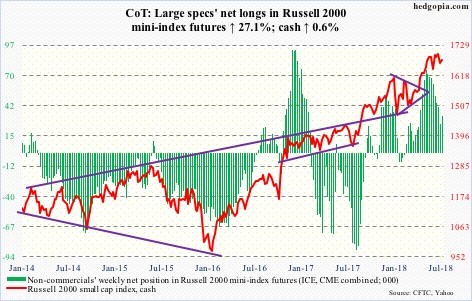
In the last six weeks, small-cap bulls have been denied at 1700-plus three times – 1708.10 on June 20, 1708.56 on July 10 and 1706.83 on July 24 – but they are not ready to give in just yet. They defended the daily lower Bollinger band in the first three sessions. For the week, the cash (1673.37) rallied 0.6 percent. If it manages to continue higher, bulls do not want to get rejected at that resistance again.
Rather encouragingly for them, after seeing redemptions in the prior five weeks totaling $2.4 billion, IWM (iShares Russell 2000 ETF) in the week to Wednesday attracted $483 million. In the same week, IJR (iShares core S&P small-cap ETF) gained $65 million (courtesy of ETF.com).
US Dollar Index: Currently net long 28.5k, up 3.2k.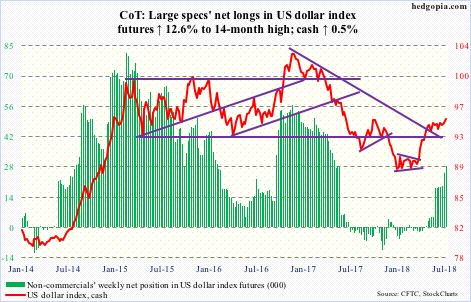
The cash (94.96) has made higher lows since May 14. The streak continued this week. Tuesday, the US dollar index stopped at 93.94. By Friday, it was testing the daily upper Bollinger band. The 95-plus level has resisted rally attempts since late May. It will be an important test. Friday, it rallied to 95.19 intraday before heading lower. A breakout will have consequences for a whole host of assets.
In the meantime, non-commercials are not aggressively building net longs, but they are not as indifferent as in the past either. This week, net longs rose to a 14-month high.
VIX: Currently net short 103.5k, up 17.3k.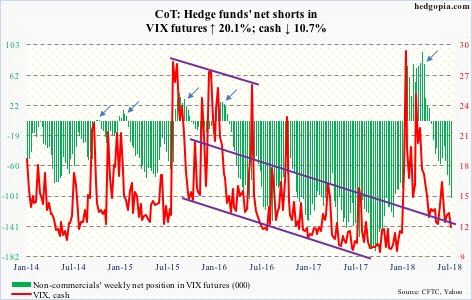
After last Friday’s rejection at the average, the cash (11.64) twice this week failed to take out the 200-day. Amidst this, the daily Bollinger bands have tightened to merely 2.3 points. When the bands contract this much, this often precedes a sharp move. VIX is already in low double digits. Unless in the sessions ahead it goes on to test the all-time low of 8.56 of last November – never say never, but unlikely – if a genuine sharp move is coming, it will have to be on the upside. At least volatility bulls hope so. Not that they did not have their share of chances of late. Over the last three months, 19-plus resisted rally attempts several times. For this to change, the 200-day needs to go first.
Disclaimer: This article is not intended to be, nor shall it be construed as, investment advice. Neither the information nor any opinion expressed here constitutes an offer to buy or sell any ...
more

