
Futures And Hedge Fund Positions Last Week
Following futures positions of non-commercials are as of April 10, 2018.
10-year note:
Currently net short 330.6k, down 44.7k.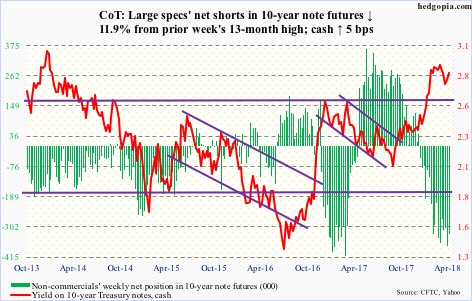
Annual core CPI rose stronger-than-expected 2.12 percent in March.This was the first year-over-year reading with a two handle in a year.
Nonetheless, core PCE – the Fed’s favorite measure of consumer inflation – is not as strong.The last time this metric rose at two percent or higher was in April 2012.Even here, it has been trending higher, with February up 1.6 percent y/y, up from 1.3 percent last August.
On Wednesday when the CPI data was published, gold rallied 1.1 percent, but 10-year Treasury yields fell a basis point to 2.79 percent.The bond market is yet to sniff inflation in earnest.The 10-year rate (2.83 percent) still has not found a way to break out of a three-decade-old descending channel it is in, although it came close a few times in recent past.
Inflation expectations – represented by the five-year, five-year forward inflation expectation rate – have been trending higher since July 2016, with two-plus readings since last December, but nothing crazy. As of Thursday, it stood at 2.21 percent.
The point is, it is too soon to conclude there has been a material shift in inflation expectations or inflation itself.Economists cite base effect for the recent upward trend in inflation.If so, it is cyclical in nature, not structural. Hence bond vigilantes’ indifferent attitude toward it.
30-year bond
:
Currently net long 34.9k, up 25.2k.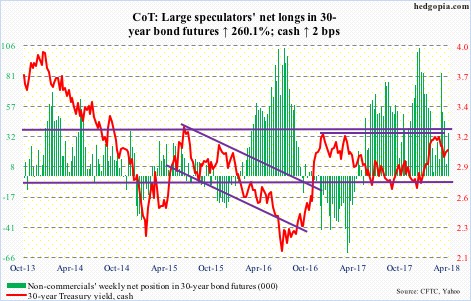
Major economic releases next week are as follows.
Retail sales (March), the NAHB housing market index (April) and Treasury International Capital data (February) are due out Monday.
Retail sales inched down 0.07 percent month-over-month in February to a seasonally adjusted annual rate of $492 billion. Year-over-year, sales rose four percent.
Homebuilder sentiment fell a point m/m in March to 70.Last December’s 74 was the highest since July 1999.
Foreigners have been loading up on US stocks.In the 12 months through January, they purchased $140 billion worth.
Housing starts and industrial production – both for March – come out Tuesday.
Housing starts declined seven percent m/m in February to 1.23 million units (SAAR).January’s 1.33 million was the highest since August 2007.
Capacity utilization in February increased three percent y/y to 78.1 percent.
Crude oil
Currently net long 742.2k, up 7.7k.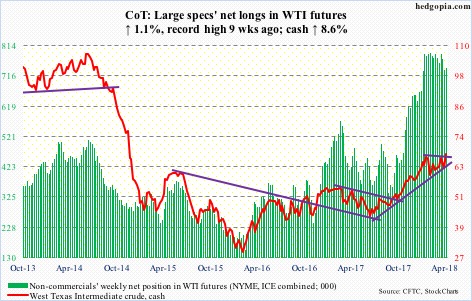
OPEC said its oil output fell to a one-year low in March amid reduced supplies from Venezuela and Saudi Arabia.This, plus the deepening Syria crisis, helped trader sentiment this week.
Spot West Texas Intermediate crude ($67.39/barrel) jumped 8.6 percent, past the prior high of $66.66 from January 25.
The EIA report for the week of April 6 otherwise was not all that positive.
US crude production continued its uptrend – up 65,000 barrels per day to 10.53 million b/d.
Crude imports jumped 752,000 b/d to 8.65 mb/d – a 33-week high.
Crude stocks rose as well, up 3.3 million barrels to 428.6 million barrels.As did gasoline stocks, which increased 458,000 barrels to 238.9 million barrels.
Distillate stocks, however, fell one million barrels to 128.4 million barrels.
Refinery utilization rose five-tenths of a point to 93.5 percent – a 13-week high.
Over the past couple of months, spot WTI has traded within an ascending triangle. It broke out this week. A retest looks imminent. The crude is right at the daily upper Bollinger band.The 10- and 20-day moving averages – both rising – lie around $64.50, with the 50-day at $62.91.
E-mini S&P 500
Currently net long 209.6k, down 3k.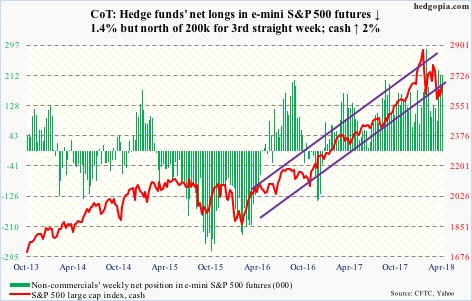
After pretty much hugging the 200-day for a couple of weeks, the cash (2656.30) proceeded to unwind the daily oversold condition this week. If the weekly chart prevails, there is room for continued strength. The problem with this scenario is that it takes time to repair the technical damage the S&P 500 suffered during and after the February selloff.
After peaking at 2872.87 on January 26, the index made a lower high on March 13. A trend line drawn from that high gets tested around 2740. Even before that, the bulls have to deal with the 50-day (2689.94); Friday, it came within nine points of the average before reversing lower. Further, the index currently is testing the underside of the broken trend line from February 2016.
The heartening news for the bulls is that flows cooperated this week, or at least until Wednesday.
In the week to Wednesday, US-based equity funds (including ETFs) took in $5.7 billion. This followed outflows of $35.6 billion in the prior three (courtesy of Lipper.com).
In the same week, $3.5 billion moved into SPY (SPDR S&P 500 ETF) and $36 million into VOO (Vanguard S&P 500 ETF), while IVV (iShares core S&P 500 ETF) lost $287 million (courtesy of ETF.com).
Euro
Currently net long 147.5k, up 13.1k.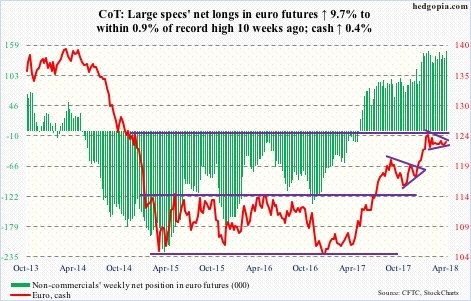
The cash ($123.44) continues to make lower highs. This has been going on since peaking at $125.37 on January 25. A falling trend line from the all-time high of $160.20 in April 2008 lies around $125.
Prior to testing this resistance, the euro has had a massive rally – from $103.53 in December 2016 or most recently from $115.58 last November. Thus, the current pause is not all that surprising. The question is, is this healthy digestion or the bulls are running out of ammo?
Non-commercials’ net longs are near record.
In this context, depending on how one draws it, a descending and/or a symmetrical triangle has formed, with support at $122-122.50.This is a must-hold.
Gold
Currently net long 155.4k, down 11.2k.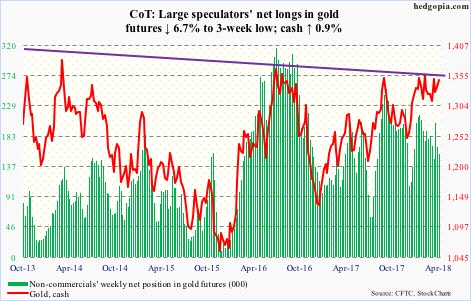
One more week, one more attack on resistance at $1,360-70/ounce on the cash, and potentially one more failure. Looks like gold bugs will have to wait for some other time for a breakout.
Wednesday, the metal ($1,347.90) rallied intraday to $1,369.40 before ending the session up 1.1 percent to $1,360, leaving behind a little bit of a tail. The daily upper Bollinger band lied right there.
The latest rally came post-defense mid-March of crucial support at $1,300.The daily chart is overbought.In a worse-case scenario for the bulls, this gets tested near term.The lower Bollinger band lies just north of $1,300, and the 200-day at $1,297.94.
Encouragingly for the bulls, flows have improved of late.In the week through Wednesday, GLD (SPDR gold ETF) attracted $341 million and IAU (iShares gold trust) $225 million (courtesy of ETF.com). In the past four, $655 million and $1.1 billion moved into the two, in that order.
Nasdaq 100 index (mini)
Currently net short 6.7k, down 9.1k.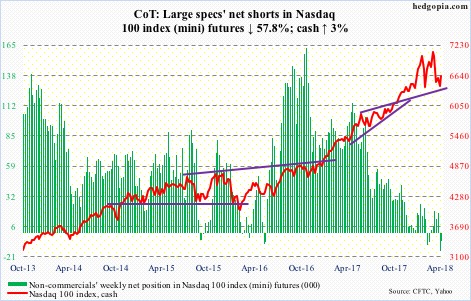
Ideally, the bulls would love to rally the cash (6628.34) to just north of 7000, which is where a false breakout occurred mid-March, resulting in an island reversal. But we are talking nearly 400 points before that happens.
The price action is encouraging, but volume continues to be an issue, leaving room for questions as to if this week’s rally is merely unwinding of oversold conditions or some genuine buying is taking place.
In the week to Wednesday, QQQ (PowerShares QQQ ETF) attracted $197 million.This comes after loss of $3.8 billion in the prior three (courtesy of ETF.com).
Russell 2000 mini-index
Currently net long 10.7k, down 9k.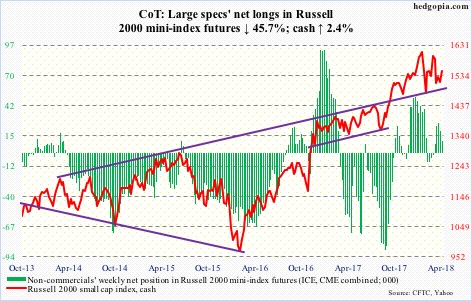
Of major US equity indices, the cash (1549.51) is the first to retake the 50-day. Weekly momentum indicators also turned up from the median.
In the week to Wednesday, IWM (iShares Russell 2000 ETF) pulled in $868 million, and IJR (iShares core S&P small-cap ETF) $248 million (courtesy of ETF.com).
In the best of circumstances, the Russell 2000 has a shot at just north of 1600, which is where a slightly falling trend line from the all-time high of 1615.52 on January 24 lies. A case for this scenario strengthens if new buying takes place at the 50-day (1538.47). A test is likely.The daily chart is getting overbought.
US Dollar Index:
Currently net short 1.8k, up 620.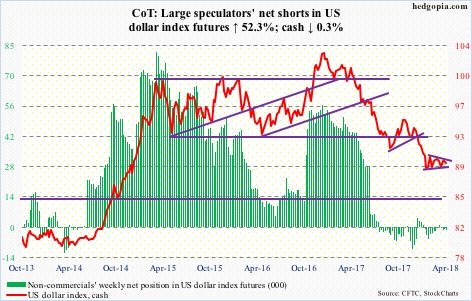
The cash (89.50) quickly dropped from the daily upper Bollinger band on Friday last week to just above the lower band this Wednesday.The back-and-forth around the 50-day continues – now slightly under.
In the meantime, the US dollar index has traced out a symmetrical triangle in the past three months.This more often than not is a continuation pattern.Thus the significance of support at 88-89, which goes back to at least 2004.
VIX
Currently net long 92.9k, up 13.8k.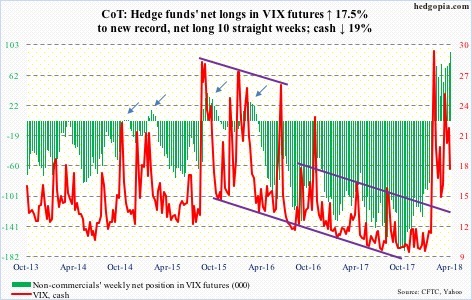
A look at the monthly chart shows the cash (17.41) has room to go a lot lower. It already has, come to think of it, having peaked at the intraday high of 50.30 on February 6. But how low likely gets decided at 15-16, which, barring a brief intraday drop below 14 early March, has held thus far. The daily lower Bollinger band lies at 15.92.
Non-commercials raised net longs to new record. If the aforementioned support goes, this may lead them to at least begin to unwind their positions. Historically, this puts downward pressure on the cash.
Disclaimer: This article is not intended to be, nor shall it be construed as, investment advice. Neither the information nor any opinion expressed here constitutes an offer to ...
more

