Ex-State-Owned Enterprises: A New Way To Access The Quality Factor
One of the biggest discussions this year has been about factors and different ways in which they can be accessed and used to build portfolios. Some approaches are crystal clear, with the goal of the factor in an index’s name—like quality, momentum, low volatility, value or size.
However, whether or not a strategy has a factor in its name is immaterial—every strategy that isn’t owning the ENTIRE market is tilting toward some factors and away from others.
Concept of Ex-State-Owned Enterprises Aligns with Quality Variables/Sectors
In the United States, the fact that publicly traded companies are meant to operate in the best interest of shareholders is pretty much a sacred truth. Venturing into emerging markets, one sees a large number of big companies that are listed on stock exchanges but that are also majority-owned by governments.
Governments may not always have the same interests as shareholders, namely maximizing profits. The fact of the matter: ANY broad-based strategy that invests in emerging markets today without a focus on avoiding government ownership will tend to invest alongside governments, as those firms are some of the largest by market capitalization in the asset class.
Return on Equity (ROE) & Return on Assets (ROA)
State ownership tends to come concentrated in sectors that are viewed as critical to the functioning of an economy; this can be in places like China (banks), Russia (energy firms), Brazil (energy and materials companies) and in many cases utility companies and telecom firms offering more basic services.
Where we see much less state ownership is among traditional consumer or technology companies.
What is interesting about these sector profiles is that they tilt toward higher “quality” sectors and away from “value” sectors. This also can be observed by the difference in both ROE and ROA for companies that are/are not state owned.
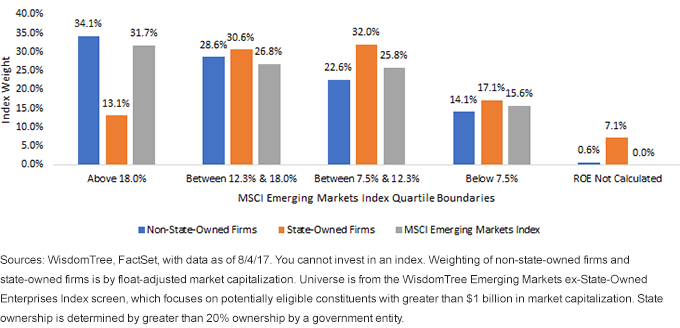
State-Owned Firms Exhibited Approximately One-Third the Weight in the Highest ROE Quartile
Return on Equity Quartile Distribution: Non-State-Owned-firms vs. State-Owned-firms (as of August 4, 2017)
(Click on image to enlarge)

- Highest-Quality Stocks: What’s most noticeable is the top ROE quartile (ROE > 18%): State-owned firms had dramatically less exposure in these most highly profitable firms.
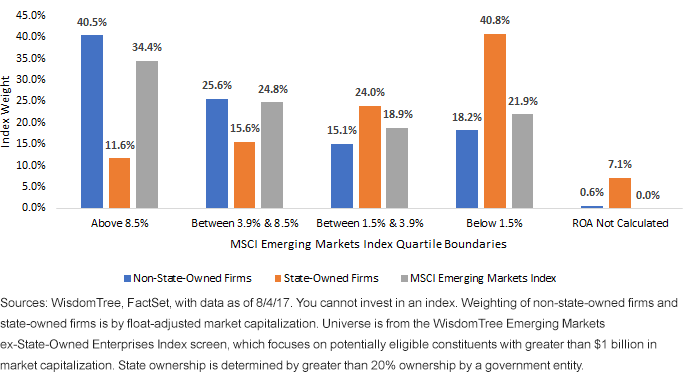
A similar pattern can be observed in return on assets.
Return on Assets Quartile Distribution: Non-State-Owned-firms vs. State-Owned-firms (as of August 4, 2017)
(Click on image to enlarge)

- The highest ROA quartile encompasses firms with ROA above 8.5%. Non-state-owned firms had exposure to this quartile of about 40.5%—almost 4x the exposure of state-owned firms at 11.6%.
- The lowest ROA quartile was also interesting—in this case indicating that state-owned firms had almost 40% weight to firms with ROA below 1.5%. This shows in some ways a tilt toward banks among state-owned firms.
In 2017, Ex-State Owned Outperformed While Quality Underperformed
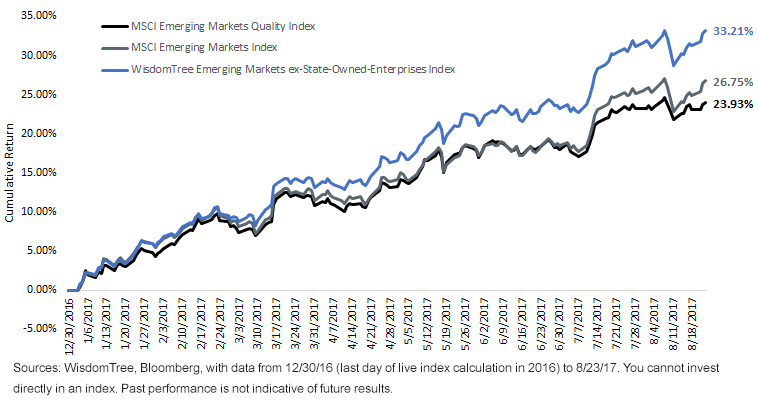
Given these tilts, one naturally would expect the WisdomTree Emerging Markets ex-State-Owned Enterprises Index to exhibit similar performance to the MSCI Emerging Markets Quality Index.
Through the better part of the first eight months of 2017, that has not been the case at all.
Ex-State-Owned Index Outperformed While Quality Index Underperformed
(Click on image to enlarge)

If one is looking to broadly characterize what the WisdomTree Emerging Markets ex-State-Owned Enterprises Index actually does, one can say that it transitions the focal point of exposure from the “old” economy to the “new” economy.
Large energy companies are the classic manifestation of state-owned firms, and they enjoyed a great run, going from 4.4% of the MSCI Emerging Markets Index in October 1999 to almost 21% in June 2008—at the time when the price per barrel of oil hit its peak of nearly $150.1 Since then, the relative performance of the emerging markets energy sector has been in decline, and this is the worst performing of the 11 sectors in emerging markets this year.
Information technology exhibited the opposite behavior, attaining approximately 20% weight in October 1999, dropping to approximately 10% weight in June 2008 and now chugging toward 30% weight if current trends of relative performance continue unabated.2 The WisdomTree Emerging Markets ex-State-Owned Enterprises Index fully emphasizes (to the tune of more than 30% weight) this sector, which is the best performing in the MSCI Emerging Markets Index this year, up nearly 50%. It also fully emphasizes the ex-state-owned component in China, where WisdomTree also has a strategy that, as of this writing, was up more than 50% year-to-date.3
Align with the Story in Emerging Markets That Is Never Out of Favor
Do we know if the current trend of overall emerging market equity outperformance will continue? No, we do not. However, no matter how bleak the outlook or performance got in 2013, 2014 and 2015, we continued to hear that emerging markets were where the bulk of the world’s population resided, and the theme of faster gross domestic product growth, increasing consumption and a rising middle class never subsided. Looking at emerging markets without the state-owned enterprises, we believe, is another way to focus on this theme and not the slower-growth, larger state-owned companies of yesterday.
Disclaimer: Investors should carefully consider the investment objectives, risks, charges and expenses of the Funds before investing. U.S. investors only: To obtain a prospectus containing this ...
more


