
End-Of-Week Sentiment And Trends
Sentiment
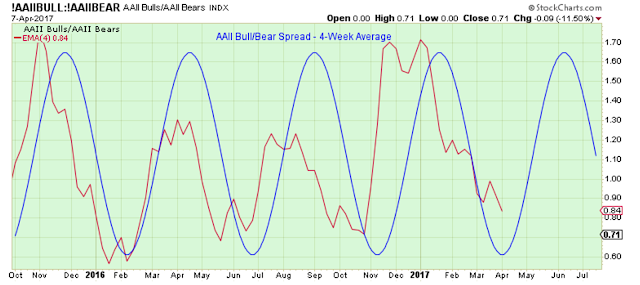
The 4-week average of the bull/bear spread of the AAII survey is getting close to a low. The blue line below is intended to be a very rough estimate of when this survey will bottom out.
This is a tough call. My other indicators are suggesting that the market is just starting to top out, but this chart would suggest that the bottom is close.
Usually we see a spike in the Vix and an increase in the number of new 52-week lows before the medium-term bottom is established. So, I am thinking this isn't the best timing tool at the moment.
Also, the Investor's Intelligence survey isn't in sync with the AAII survey. II suggests that the number of bulls is a bit high at the moment. (I am a big fan of the II survey.)
At the moment, I am not sure the AAII survey is the best market timing tool.
The Short-Term Trend
I am still hoping that DecisionPoint will change their minds and start to publish the PMO index again. Otherwise, I have to start tracking it myself manually and I really don't want to do that.
If you get a chance, send a note to the support team of stockcharts.com and ask them to start publishing the !PMOBUYALL indicator again. They don't seem to realize how valuable this indicator can be.
In the mean time, I am working on a new way to track the short-term trend, and I am leaning towards just letting the breadth indicators determine the trend rather than the prices of the major indexes.
It seems as though if you wait for price to confirm then a big portion of the short-term has already been made. Someone suggested using the Summation index, but that index always turns a few days after the new trend is established.
I need something like the PMO that warns of a change in trend and gets you in there right when the change happens... not a few days later.
The Leader List
I adjusted the technicals a bit so that I can buy into ETFs earlier in their uptrend. Of course, that means there is a bit more risk that a trend will fail, and also there will be more whipsaws above and below the SPX benchmark.
Materials and Pharmaceuticals are now leaders, and South Korea has fallen out of favor.

This is a nice uptrend for Materials, but it looks too late in the rally to be buying now.

I like this chart of Pharmaceuticals much better. Plus, this is a defensive group that fits in much better with a trend that is probably rolling over and getting ready for a correction.
Watching this group of stocks is like witnessing a snail race. But as this aging bull market gets closer to its final stages I think this group should do well compared to the other groups.

This isn't a bad looking chart, and it could find support at the 50-day. I got shaken out of this position, and I am regretting it now. If I had gotten in earlier I probably wouldn't have been stopped out when it dipped below the 20-day.

Outlook
The long-term outlook is positive.
The medium-term trend is down as of March 21
Disclaimer: I am not a registered investment advisor. My comments above reflect my view of the market, ...
more

