
Earnings And GDP Temporarily Take Investor Spotlight Off The Fed
As we get into the heart of earnings season and anticipate the GDP report for Q1, the investor spotlight has been taken off the Federal Reserve and timing of its first interest rate hike, at least temporarily. Even though Q1 economic growth will undoubtedly look weak, the future remains bright for the U.S economy – even though many multinationals will struggle with top-line growth due to the strong dollar – and any near-term sell off resulting from weak economic or earnings news should be bought yet again in expectation of better results for the balance of the year. High sector correlations remain a concern, reflecting herd-like risk-on/risk-off behavior rather than thoughtful stock-picking.
In this weekly update, I give my view of the current market environment, offer a technical analysis of the S&P 500 chart, review our weekly fundamentals-based SectorCast rankings of the ten U.S. business sectors, and then offer up some actionable trading ideas, including a sector rotation strategy using ETFs and an enhanced version using top-ranked stocks from the top-ranked sectors.
Market overview:
Similar to Q1 2014, it appears that severe winter weather in the US is going to reveal its harsh impact on Q1 economic activity, which is likely to show economic growth near zero or even negative. GDP is scheduled to be released on April 29. Other negative factors include cutbacks in Energy sector spending, the West Coast port slowdown, and the strong dollar. Already, we have seen consumer spending flat or declining in December, January, and February, jobs growth has slowed, and U.S. retail sales had its worst 3-month performance since 2009. Nevertheless, most economists are still forecasting positive growth, so investors might decide to sell first and let the dust settle if/when bad numbers are actually released.
With the reduced expectation for corporate earnings, the S&P 500 has a forward valuation that has reach about 17x. Moreover, the CAPE (cyclically-adjusted P/E) has reach about 28x, which is the highest since the pre-meltdown years of 1928 and 2007.
Of course, the 10-year US Treasury bond was yielding around 4.5% in July 2007, whereas it closed last week at 1.95%, so the equity markets can justify higher valuation multiples. Nevertheless, a poor GDP report could send equity investors scurrying for cover while the 10-year yield would likely retreat to its January low near 1.7%. But I would take such circumstances as yet another buying opportunity in anticipation of better economic news going forward, given the milder weather. There is still underlying US economic strength and a cautious optimism of continued recovery, despite the strong dollar. With their general focus on the domestic market, small caps in particular should continue to thrive.
The Fed has had it ZIRP (zero interest rate policy) in place since December 16, 2008. Today, given the tight credit spreads (which indicates optimism about continued recovery), low unemployment (near the Fed’s target), and a strong equities market (that is still somewhat undervalued relative to bonds), some are predicting the first fed funds rate hike will finally arrive in June. However, given the absence of inflation and a strong (and strengthening) dollar, I think the Fed might choose to hold off until September, particularly if the Q1 GDP growth is weak.
The CBOE Market Volatility Index (VIX), a.k.a. fear gauge, closed Friday at 12.58, which is now well below the 15 threshold between investor fear and complacency. Notably, ConvergEx reports that the average price correlation among the 10 S&P 500 business sectors continued to be quite high at 82% (although Energy stocks were 53% correlated). Moreover, EAFE stocks (in US dollars) also showed 82% correlation to the S&P 500, while emerging market stocks showed 77% correlation. As for high yield bonds, they showed only a 57% correlation to the S&P 500. Of course, it’s much more preferable for there to be low correlations reflecting investor selectivity in their choices, rather than herd-like risk-on/risk-off behavior.
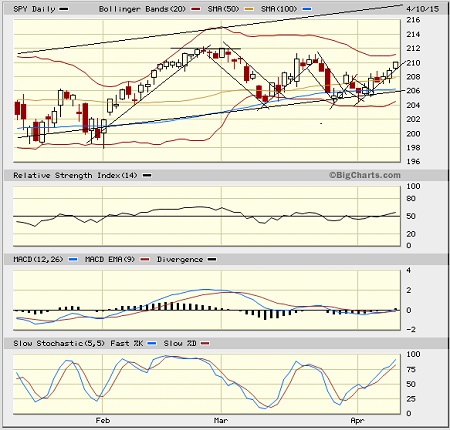
SPY chart review:
The SPDR S&P 500 Trust (SPY) closed Friday at 210.05 after a strong week. Once again, it found reliable support at the lower uptrend line of the long-standing bullish rising channel, bolstered by the 100-day simple moving average. Each test of support led to a successively smaller bull flag continuation pattern, and only time will tell as to whether the latest bounce will lead to a challenge of the February highs near 212. Oscillators RSI, MACD, and Slow Stochastic are all on a bullish trajectory. In last week’s article, I predicted a strong move one direction or the other but with an expectation that it would be to the upside. We’ll see whether the bulls can keep it going given the anticipation of market-moving earnings and economic reports that will come out over the next few weeks, and of course the historically weak month of May lurking on the horizon. Below the 100-day SMA and the uptrend line resides the critical 200-day SMA (around 202) followed by round-number support at the 200 price level.
Latest sector rankings:
Relative sector rankings are based on our proprietary SectorCast model, which builds a composite profile of each equity ETF based on bottom-up aggregate scoring of the constituent stocks. The Outlook Score employs a forward-looking, fundamentals-based multi-factor algorithm considering forward valuation, historical and projected earnings growth, the dynamics of Wall Street analysts’ consensus earnings estimates and recent revisions (up or down), quality and sustainability of reported earnings (forensic accounting), and various return ratios. It helps us predict relative performance over the next 1-3 months.
In addition, SectorCast computes a Bull Score and Bear Score for each ETF based on recent price behavior of the constituent stocks on particularly strong and weak market days. High Bull score indicates that stocks within the ETF recently have tended toward relative outperformance when the market is strong, while a high Bear score indicates that stocks within the ETF have tended to hold up relatively well (i.e., safe havens) when the market is weak.
Outlook score is forward-looking while Bull and Bear are backward-looking. As a group, these three scores can be helpful for positioning a portfolio for a given set of anticipated market conditions. Of course, each ETF holds a unique portfolio of stocks and position weights, so the sectors represented will score differently depending upon which set of ETFs is used. We use the iShares that represent the ten major U.S. business sectors: Financial (IYF), Technology (IYW), Industrial (IYJ), Healthcare (IYH), Consumer Goods (IYK), Consumer Services (IYC), Energy (IYE), Basic Materials (IYM), Telecommunications (IYZ), and Utilities (IDU). Whereas the Select Sector SPDRs only contain stocks from the S&P 500, I prefer the iShares for their larger universe and broader diversity. Fidelity also offers a group of sector ETFs with an even larger number of constituents in each.
Here are some of my observations on this week’s scores:
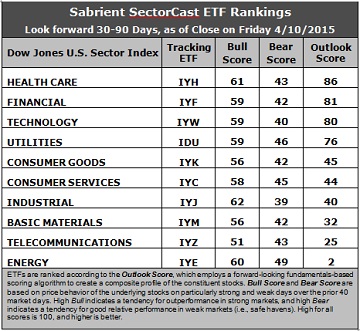
1. Healthcare remains in first place with a solid Outlook score of 86. Healthcare displays good sell-side analyst sentiment (net revisions to earnings estimates) and above average scores in most factors in the model, including return ratios, forward long-term growth rate, and insider sentiment (buying activity). Financial takes second with a score of 81, with reasonably good analyst and insider sentiment and the lowest forward P/E. Technology falls to third this week at 80 and still displays good factor scores across the board, including the highest return ratios.
2. The rankings have returned to their 3-tier bunching of Outlook scores. After Healthcare, Financial, Tech, and Utilities at the top, the middle tier has Consumer Goods (Staples/Noncyclical), Consumer Services (Discretionary/Cyclical), Industrial, and Basic Materials, and at the bottom remains Energy and Telecom. Energy continues to hold the bottom spot with an Outlook score of 2 given the persistent weakness in oil prices and the ongoing downward earnings revisions from Wall Street. Energy is among the worst in all factors in the model, including a forward long-term growth rate near zero and by far the highest forward P/E.
3. Looking at the Bull scores, Industrial displays the top score of 62, followed by Healthcare. Notably, Energy saw its score rise quite a bit this week all the way up to 60. Telecom sports the lowest Bull score of 51. Once again, all scores are above 50, and the top-bottom spread remains relatively narrow at only 11 points, which reflects elevated sector correlations (i.e., broad risk-on buying). It is generally desirable in a healthy market to see low correlations reflected in a top-bottom spread of at least 20 points, which indicates that investors have clear preferences in the stocks they want to hold.
4. Looking at the Bear scores, Energy displays the highest (i.e., best) score of 49, which means that stocks within this sector have been the preferred safe havens (relatively speaking) on weak market days. Industrial is the lowest at 39. The top-bottom spread remains a narrow 10 points, which reflects elevated sector correlations on particularly weak market days (i.e., broad risk-off selling). Ideally, certain sectors will hold up relatively well while others are selling off, so it is generally desirable in a healthy market to see low correlations reflected in a top-bottom spread of at least 20 points.
5. Healthcare displays the best all-around combination of Outlook/Bull/Bear scores, while Energy is the worst. Looking at just the Bull/Bear combination, Energy has surged to the top, followed by Utilities and Healthcare, indicating superior relative performance (on average) in extreme market conditions (whether bullish or bearish), while Telecom scores the worst.
6. Overall, this week’s fundamentals-based Outlook rankings have taken a slightly more defensive tone, given the move in Utilities and Consumer Goods (Staples/Noncyclical), and the fall in Industrial. Thus, I would characterize the rankings as neutral. Keep in mind, the Outlook Rank does not include timing or momentum factors, but rather is a reflection of the fundamental expectations of individual stocks aggregated by sector.
Stock and ETF Ideas:
Our Sector Rotation model, which appropriately weights Outlook, Bull, and Bear scores in accordance with the overall market’s prevailing trend (bullish, neutral, or defensive), has returned to a bullish bias and suggests holding Healthcare, Financial, and Technology in that order. (Note: In this model, we consider the bias to be bullish from a rules-based trend-following standpoint when SPY is above both its 50-day and 200-day simple moving averages.)
Other highly-ranked ETFs from the Healthcare, Financial, and Technology sectors include First Trust NYSE Arca Biotechnology Index Fund (FBT), First Trust NASDAQ ABA Community Bank Index Fund (QABA), and First Trust NASDAQ Technology Dividend Index Fund (TDIV).
For an enhanced sector portfolio that enlists some top-ranked stocks (instead of ETFs) from within the top-ranked sectors, some long ideas from Healthcare, Financial, and Technology sectors include Valeant Pharmaceuticals (VRX), Regeneron Pharmaceuticals (REGN), FirstMerit Corp (FMER), PacWest Bancorp (PACW), Ambarella (AMBA), and Skyworks Solutions (SWKS). All are highly ranked in the Sabrient Ratings Algorithm.
If you prefer to maintain a neutral bias, the Sector Rotation model still suggests holding Healthcare, Financial, and Technology, in that order. But if you prefer a defensive stance on the market, the model suggests holding Healthcare, Utilities, and Energy, in that order.
Disclosure: Author has no positions in stocks or ETFs mentioned.
Disclaimer: This newsletter is published solely for informational purposes and is not to be construed as advice ...
more

