
Don’t Be The Turkey

Let’s start with where we left off last week for some context.
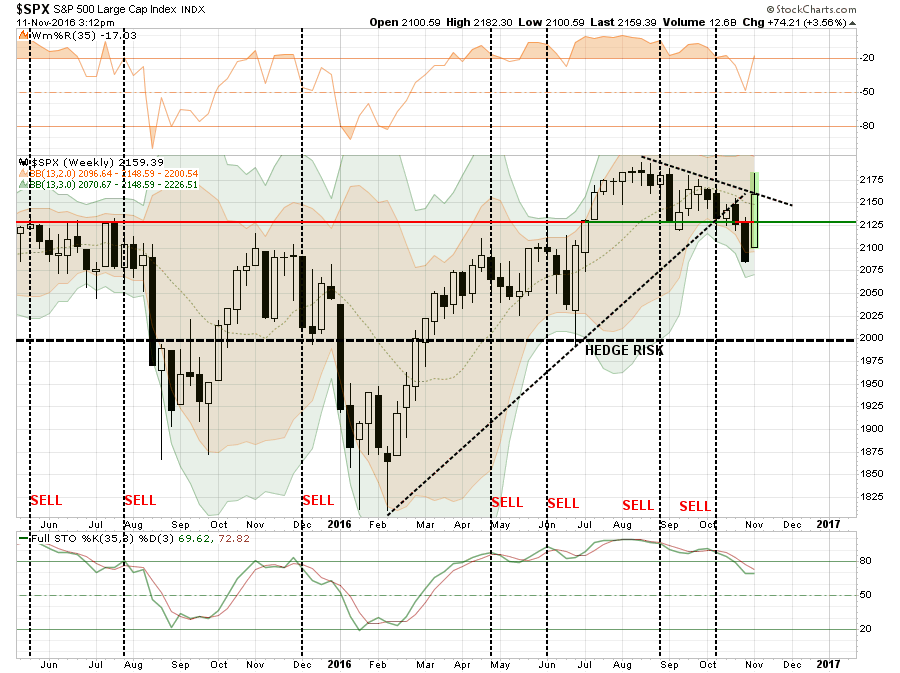
“The post ‘Trexit’ rally that started on Wednesday took out the first two levels of resistance with some ease. However, the “sell signal” remains intact with the market now back to extreme overbought levels as shown by the red circles at the top of the chart.
The good news is the market is holding above the downtrend resistance line currently which puts all-time highs as the next logical point of attack if this bull market is to continue.
However, is we step back to a longer-term (weekly) picture we get a little clear picture about the overall directional trend of the market.”
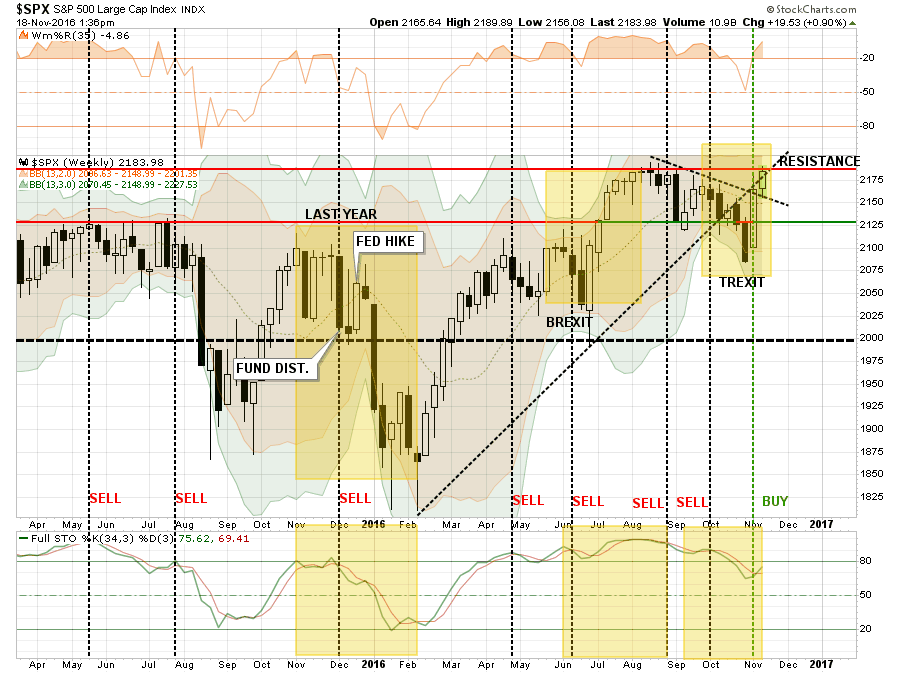
The good news, as shown in the next chart, is the market was able to clear that downtrend resistance this week and turn the previous “sell signal” back up. As suggested previously, it is not surprising the markets are pushing all-time highs as we saw on Friday.
But what about after that? As I noted on Friday:
“Importantly, with next week being a light trading week, it would not be surprising to see markets drift higher. However, expect a decline during the first couple of weeks of December as mutual funds and hedge funds deal with distributions and redemptions. That draw down, as seen in early last December, ran right into the Fed rate hike that set up the sharp January decline.”
As I have noted above, there are a lot of similarities in market action between the “post-Trexit” bounce,“Brexit” and last December’s Fed rate hike. I have highlighted there specific areas of note in the chart above.
As with “Brexit” this past June, the markets sold off heading into the vote assuming a vote to leave the Eurozone would be a catastrophe. However, as the vote became clear that Britain was voting to leave, global Central Banks leaped into action to push liquidity into the markets to remove the risk of a market meltdown. The same setup was seen as markets plunged on election night and once again liquidity was pushed into the markets to support asset prices forcing a short-squeeze higher.
But let’s go back to Thanksgiving of last year as well. As I wrote back then:
“With the markets currently oversold on a very short-term basis, the current probability is a rally into the ‘Thanksgiving’ holiday next week and potentially into the first week of December. As opposed to my rudimentary projections, the push higher will likely be a ‘choppy’ advance rather than a straight line.
In early December, I would expect the markets to once again pull back from an overbought condition as mutual funds distribute capital gains, dividends, and interest for the year. Such a pullback would once again reset the market for the traditional ‘Santa Claus’ rally as fund managers ‘window dress’ portfolios for their end-of-year reporting.
This is only an expectation based on seasonal tendencies of the market. As I have stated repeatedly, the current setup is opportunistic for very short-term, nimble and disciplined traders. However, for long-term investors looking to managing risk and preserve capital, the current market environment is no longer friendly and is beginning to border on hostile.”
Interestingly, that same analysis applies today just as much as it did a year ago. With the markets trying to play catch up after a sloppy summer, pushing extreme overbought conditions, and with the Fed once again lifting rates – the backdrop is all too familiar.
Combine the current backdrop with a sharply higher dollar and interest rates and you have all the makings for a rather nasty correction.
Everything Is Awesome
As Eric Parnell, CFA noted on Seeking Alpha this past weekend:
“The dawn of a new era of pro-growth economic policies has suddenly come upon us, filled with massive fiscal stimulus, generous tax cuts and decreased regulation. As a result, the time has come effectively overnight in investor portfolios to abandon the safe haven of U.S. Treasuries and get reflationary!”
The whole article is a very good read and digs into the misconceptions currently existing across asset markets. However, here is an important conclusion:
“Everything is NOT awesome. I’m not saying in this statement that things might not eventually become truly awesome someday in the future, as I genuinely hope they do and believe they can. But things have not suddenly become awesome over the course of the past week. Instead, it’s going to take a long (loooong) time and a lot of potentially painful and tenuous adjustments along the way to get back to awesome. And this does not mean that markets should not move well in advance to price in this potential awesome returning at some point in the future.
But outside of the rise of the U.S. stock market, which when you dissect it has taken place in three specific trading days with the vast majority of it coming the day after the election on Wednesday of last week, we are actually seeing very little evidence in securities prices of the supposed awesomeness that so many analysts and pundits are proclaiming is all but certain in recent days.
All of this raises an important point. It is very easy to be sucked into the gushingly positive narratives and often unsupported narratives put forth by the financial media. This is particularly true when the move in asset prices can make minutes seem like days and hours seem like months. But when it comes to managing your own investment portfolios, it is critically important to do your own research to confirm or refute the narratives that you are hearing. For the reasons for what is actually taking place at any given point in time may end up leading to decidedly different outcomes.
This also leads to perhaps an even more important point. We should all remember that just as a stock market can rise relentlessly and valuations can increase despite a largely stagnant economy thanks to extraordinarily accommodative monetary policy, so too can a stock market fall relentlessly and valuations compress despite a steadily growing economy as a result of restrictive monetary policy.
In fact, monetary policy does not even need to be restrictive to see stocks fall into a bear market. For so much air has been put under a stock market that continues to trade at its highest valuations in history that even a solidly growing economy can come with a good dose of valuation compression.”
Excessive market valuations, weak internal measures, and a deteriorating backdrop has historically been a “wicked brew” for investor outcomes.
While markets can certainly remain “irrational longer than you can remain solvent,” the secret to “solvency” is understanding “when” to make an investment “bet.” A professional gambler only goes “all-in” when he“knows” he has a winning hand. He also knows when to “fold” and minimize his losses. For long-term investors, the risk to “solvency” greatly exceeds the “reward” currently.
For short-term traders, a breakout to new highs will likely provide a short-term trading opportunity to speculate in the market. However, gains will likely be limited and risk of failure is high.
The Great Bond Crash of 2016
“OMG…Are interest rates ever going to stop rising? My bond funds are getting crushed.”
Actually, it isn’t just bond funds it is all interest rate sensitive sectors of the market. But, as I have discussed many times in the past, this is the problem particularly with bond funds and ETF’s – WHICH ARE NOT BONDS.
Actual bonds, which are the only thing you should buy for fixed income in your portfolio, have two key factors:
- An actual interest payment is made at specific intervals during the life of the bond, and;
- A return of principal function at maturity.
Everything else, bond funds, bond ETF’s, preferred stocks, REIT’s, MLP’s, closed-end funds, and target-date funds that have been passed off as bond substitutes, ARE NOT BONDS.
Interest rates sensitive investments are a trade on the direction of interest rates, just as stocks are a trade on the direction of the equity markets. No more. No less.
And, as you have seen recently, they can, do and will lose value.
However, let’s also put the recent correction in rates into a bit of perspective.
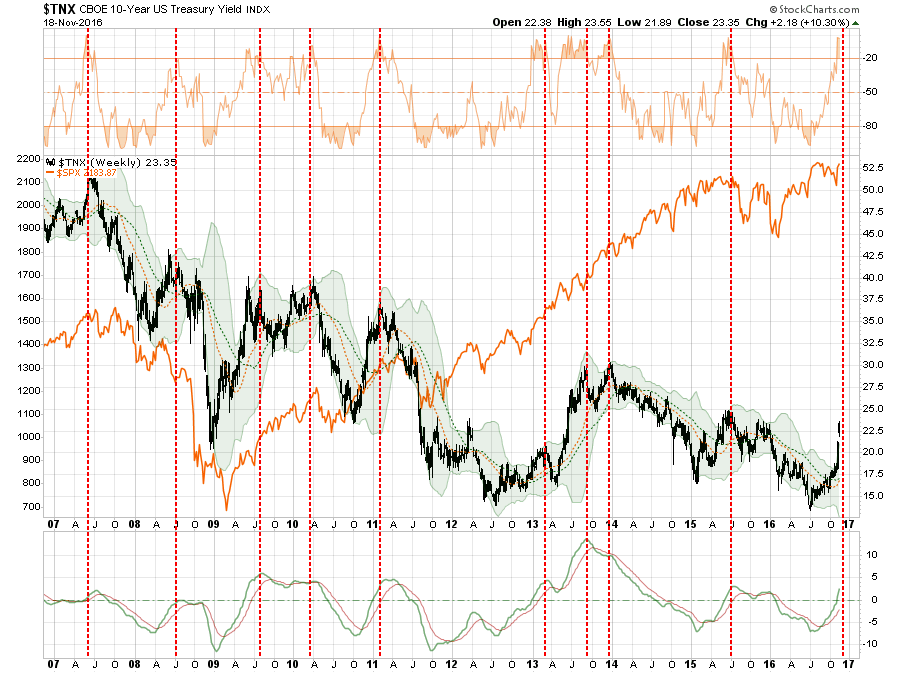
Let’s start with my analysis from last week:
“However, the spike in rates this past week, now has me buying bond ETF”s for a trading opportunity.As shown below, interest rates are now pushing overbought conditions only seen near absolute peaks in interest rates movements. (Orange circles)”
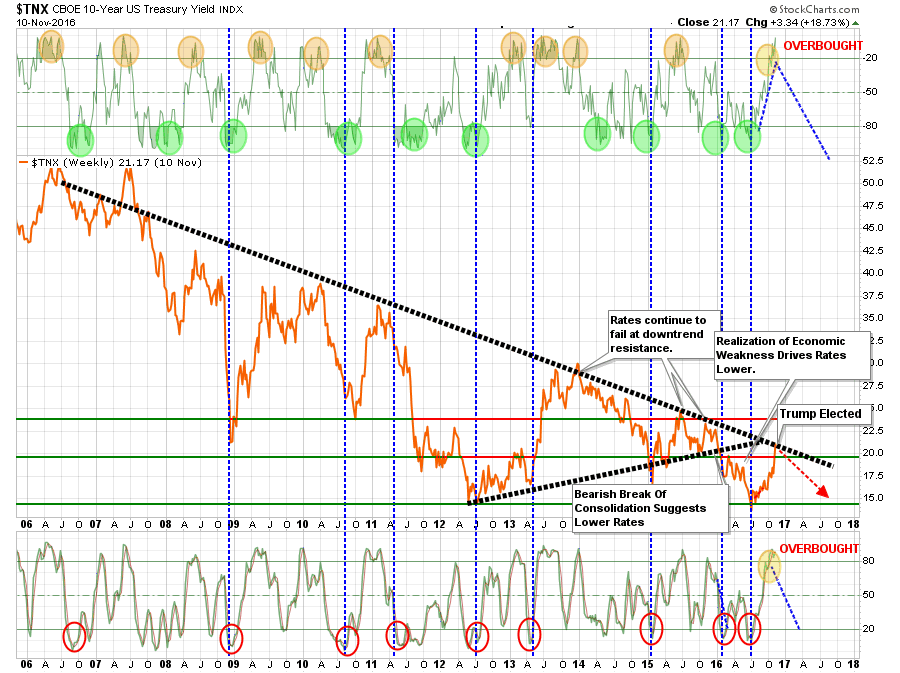
“What is interesting is that stock buyers are told to buy stocks after big corrections, yet it works EXACTLY the same way with bonds. When interest rates spike, bonds become VERY oversold and operate on exactly the same premises as stocks.
So, bonds are now EXTREMELY oversold and this is as good of an opportunity as one will get to buy bonds.
Does this mean rates will plunge on Monday? No. Rates could go a bit higher from here, but it will likely not be much. As Jeff Gundlach stated last week:
“I do think this rate rise is about 80% through. If yields rise beyond ‘critical resistance’ levels, including 2.35% on the 10-year note, then things are in really big trouble.”
He is right, higher rates negatively impact economic growth. But in BOTH CASES, the outcome for bonds is EXCELLENT.”
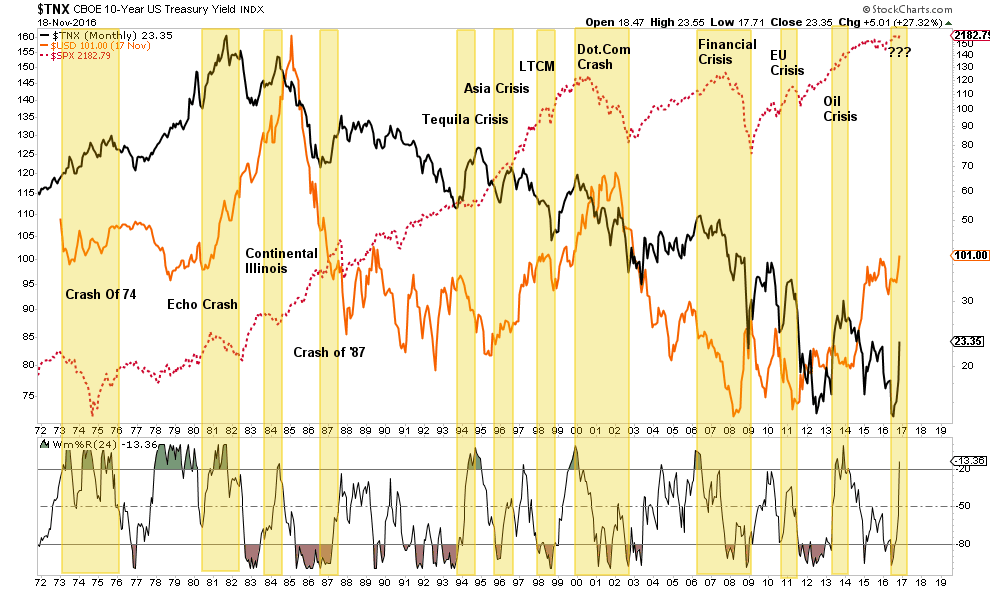
Rates did drift slightly higher this week as stated but still well within the context of the long-term downtrend. The chart below shows the long-term trend of the 10-year Treasury going back to 1978 as compared to its RSI index and I have circled the recent “surge” in rates.
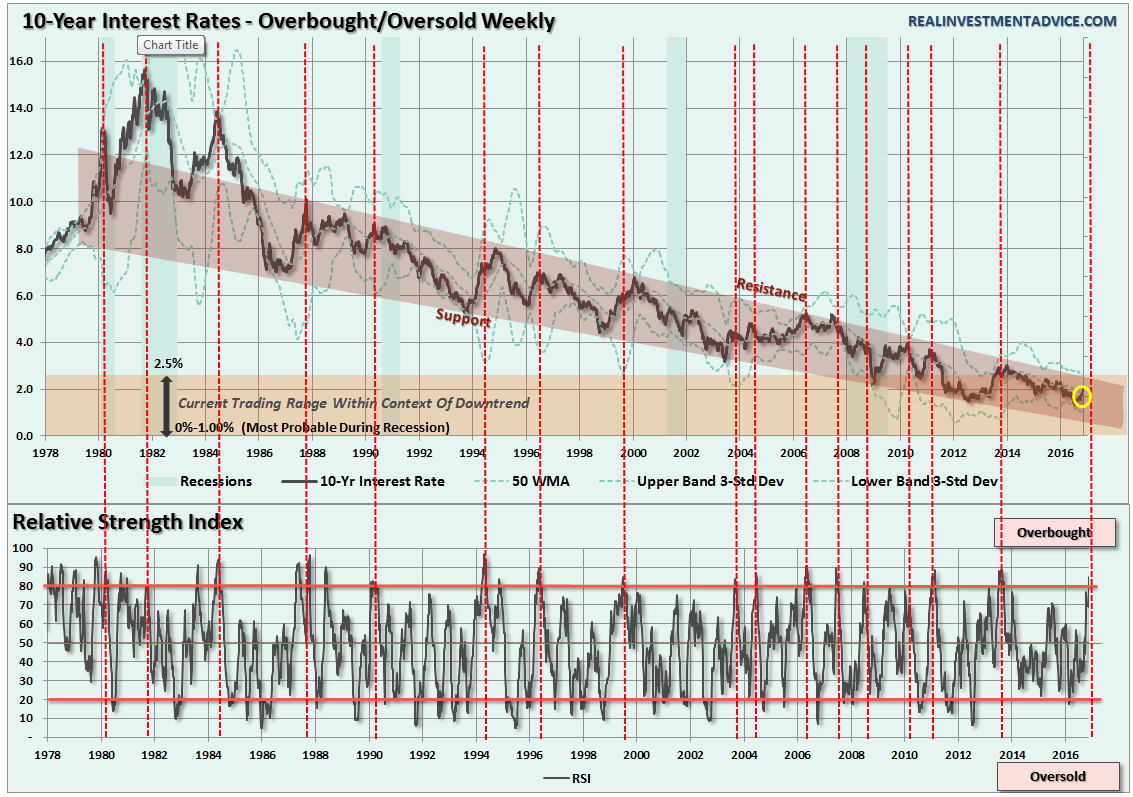
When put into this context, the rise is barely noticeable. However, what is notable is that historically whenever the RSI on rates has exceeded 80%, red dashed lines, it has preceded a subsequent decline in rates. In other words, overbought rates are a signal to buy oversold bonds for a potential reversion trade.
However, the coincident surge in both rates AND the dollar have also put the markets at risk of a bigger “impact correction” due to the simultaneous strain the surging dollar and rates put on foreign exchange and economies. History is littered with incidents that have coincided with similar environments.
Sure, this time could be different…it just usually isn’t.
As Horseman Capital recently penned in a letter to their investors:
“The problem with sharply higher US bond yield is that this tightens financial conditions. We have often seen rises in yield coincide with financial market crises. A rise in yields preceded the 1987 market crash.A rise in yield in 1994 preceded the Tequila crisis, when the Mexican peso devalued by half.After both events, yields quickly fell to new lows. Yields rose in 1996/7 before the Asian Financial Crisis, and yields again rose in 1999 before the dot com crash.After bothevents, yields fell to new lows. More recently, bond yields rose in 2006 before the Global Financial Crisis, and again in 2010/1before the Euro-crisis. There was also a rise in yields before the crash in oil prices in 2014.In all cases yields fells to new low.”
Let me repeat:
“While the punditry continues to push a narrative that ‘stocks are the only game in town,’ this will likely turn out to be poor advice. But such is the nature of a media driven analysis with a lack of historical experience or perspective.
From many perspectives, the real risk of the heavy equity exposure in portfolios is outweighed by the potential for further reward. The realization of ‘risk,’ when it occurs, will lead to a rapid unwinding of the markets pushing volatility higher and bond yields lower.”
Here is the most important point.
“Just one month ago, we were told that U.S. equities should rise because bond yields would be low forever, discount rates should trend toward 0% and therefore equity valuations should trend toward infinity over time. Now, we’re told that despite bond yields surging we can still count on U.S. equities trending toward infinity because they’re better positioned to absorb higher rates than emerging markets.”
It can’t be both.
While the belief currently is the policies being promoted by President-elect Trump are both stimulative and inflationary, my view aligns with Dr. Lacy Hunt of Hoisington Capital Management:
“Markets have a pronounced tendency to rush to judgment when policy changes occur. When the Obama stimulus of 2009 was announced the presumption was that it would lead to an inflationary boom. Similarly, the unveiling of QE1 raised expectations of a runaway inflation.
Yet, neither happened. The economics are not different. Under present conditions, it is our judgment that the declining secular trend in Treasury bond yields remains intact.”
This is the most important point. Over the intermediate to longer-term time frame, when considering economic and fundamental underpinnings, the consequences of aggressive equity exposure are entirely negative as the rising dollar/yield combination exacerbates the ongoing earnings recession.
In other words, a traditionally overvalued equity market will die a very traditional death.
Investors Get A Bit Too Comfortable
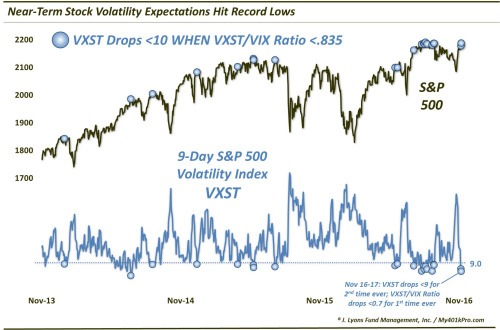
“Near-term volatility expectations have plunged to record lows.
On November 11, 2 days after the election, we wrote a post titled “Traders Breath Unprecedented Sigh Of Relief Following Election”. The impetus here was the fact that the VXST/VIX ratio, as well as the VIX/VXV (3-Month VIX) ratio, each saw their largest daily drop ever on the November 9 election day. In other words, traders had seen their relative comfort level improve faster than any other date in history.
That was a week ago. Fast forward to today and we see that, not only have volatility expectations vastly improved on a relative basis, they are now testing all-time record lows on an absolute basis. The VXST, specifically, printed an 8-handle (8.98) for just the 2nd time in its history today. Furthermore, the VXST/VIX ratio closed at an all-time low yesterday, moving below 0.7 for the first time ever. That indicates that traders already had low relative volatility expectations for the near-term. And, clearly, their comfort level has come full circle since just prior to the election.
So what’s the point – besides the triviality of the cycle – or the lesson about traders’ inevitable comeuppance once they’ve become too prepared for volatility? Well, looking historically, the combination of an extremely low VXST and an extremely low VXST/VIX ratio has not been kind to the S&P 500, at least in the short-term.
Specifically, after these past 2 days, there have now been 21 days in the past 3 years in which the VXST dropped below 10 while the VXST/VIX ratio was less than 0.835.”
“To utter those famous last words, this time may be different, but as we mentioned, the S&P 500 demonstrated consistent struggles in the short-term following the previous 19 occurrences.”
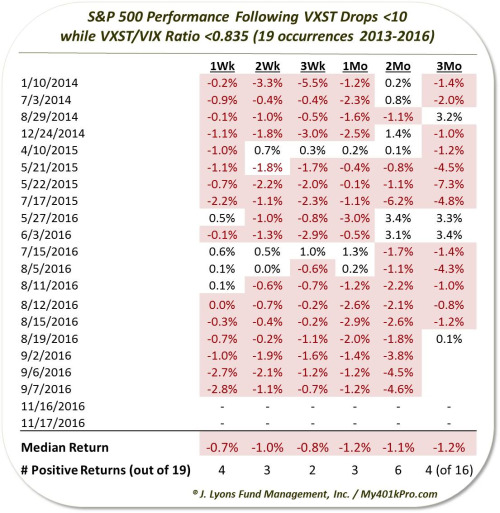
“Some of the dates are clustered during this past August-September. But interestingly, they were mostly singular events, suggesting that these conditions are extreme, and unsustainably so. Therefore, whatever effects tend to occur as a result of such conditions, they tend to happen right away. Naturally, those include a rise in short-term volatility expectations and, as the table indicates, softness in stocks.
A week later, the S&P 500 was higher just 4 of 19 times, and it didn’t get any better after a month with just 3 winners. Even after 3 months, the 16 occurrences with enough data were lower three quarters of the time. The most consistently weak spot was 3 weeks following the readings. 17 of the 19 dates saw lower stock prices by then.
The consistency of the drawdowns (not shown) also jumps out. Within 2 weeks, 14 of the 19 occurrences had seen -1% drawdowns. By 1 month later, 15 of the 19 had experienced drawdowns of at least -2%.
That said, the weakness, while consistent, tended to be rather limited. For example, while 16 of the 19 days saw losses 1 month later, none of them were down even as much as 3% (unrounded). Even the drawdowns saw just 5 of the 19 down by as much as 3% at any point during the first month.
Certainly the limited magnitude of the losses has to do somewhat with the benign, range-bound environment that existed over most of this study period. Therefore, perhaps it’s just coincidence. And perhaps the losses following similar conditions as we are seeing now is just a coincidence. However,17 losses out of 19 occurrences would suggest otherwise. It suggests that perhaps traders had just gotten a bit too comfortable with the stock market at those junctures, at least in the near-term.
And they have never been as comfortable as they are now.”
THE MONDAY MORNING CALL
The Monday Morning Call – Analysis For Active Traders
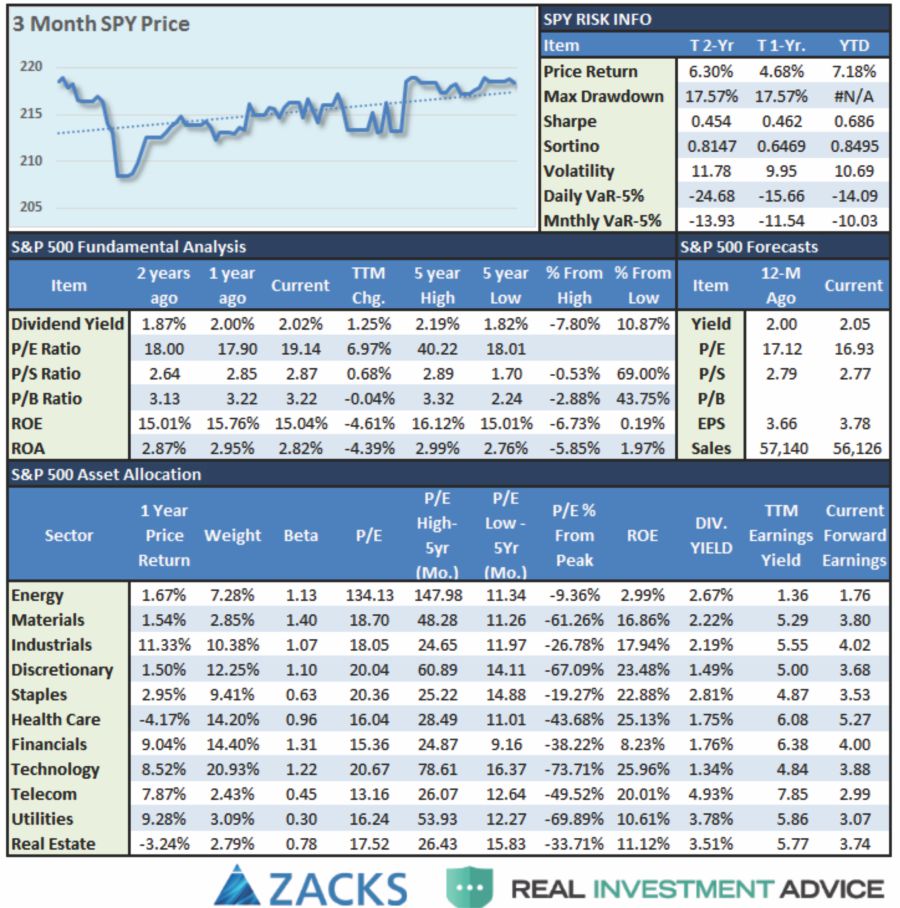
S&P 500 Tear Sheet
Starting this weekend, I will be adding an S&P 500 Tear Sheet which I have been working on with my friends at Zack’s Research. If you have any suggestions or additions you would like to see, send me an email.
Model Update
S.A.R.M. Sector Analysis & Weighting
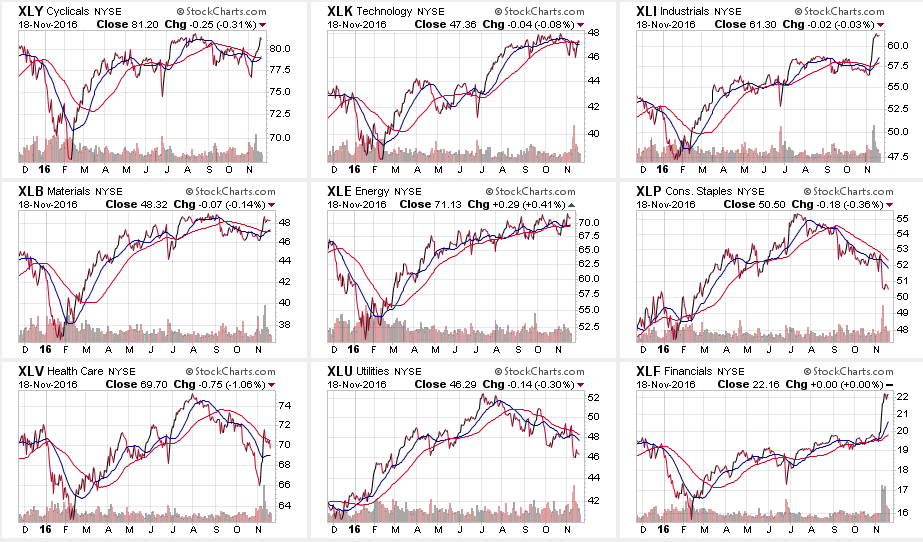
While the markets seemed to rally broadly last week, such was really not the case when we look at individual areas.
While Discretionary, Industrials, Materials, and Financials rallied sharply post the election on a bet of a “reflation” trade, only Industrials and Financials substantially broke out to new highs. The problem, as stated above, is that a stronger dollar and higher interest rates will likely hamper this optimism sooner rather than later.
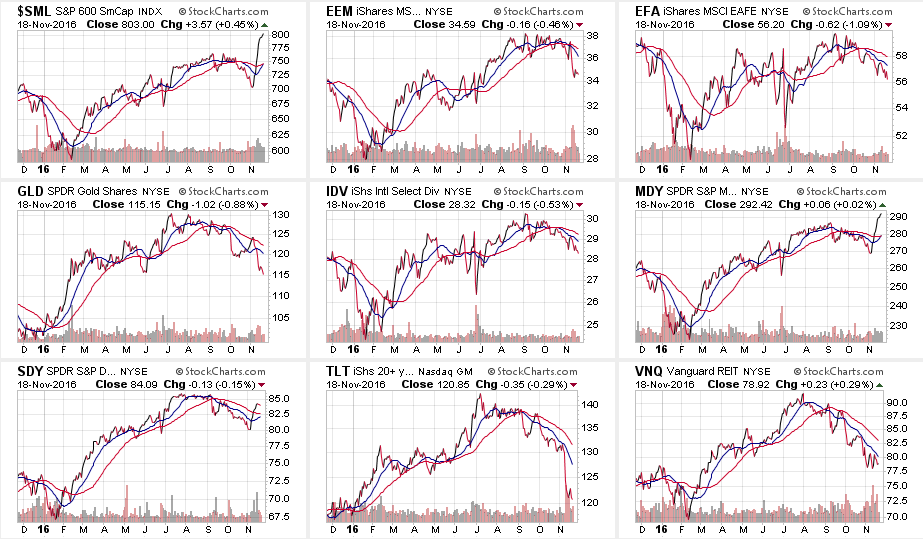
In the broader markets, Small and Mid-Caps surged on this same bet. Unfortunately, as stated above, these two areas are also the MOST susceptible to the negative impacts of exports and carrying costs. Profits should be taken now.
Let’s take a look at the equal weighted portfolio model.
(Note: This is an equally weighted model example and may differ from discussions of overweighting/underweighting specific sectors or holdings.)
The overall model still remains underweight target allocations. This has been due to the inability of the markets to generate a reasonable risk/reward setup to take on more aggressive equity exposure at this time.
However, the rally last week which pushed the markets back above the 50-dma keeps portfolios allocated at model weights. Provided the markets can reduce the current overbought condition, without triggering further “sell signals” model allocations will be able to be increased for the seasonally strong period.
Relative performance of each sector of the model as compared to the S&P 500 is shown below. The table compares each position in the model relative to the benchmark over a 1, 4, 12, 24 and 52-week basis.
Historically speaking, sectors that are leading the markets higher continue to do so in the short-term and vice-versa. The relative improvement or weakness of each sector relative to index over time can show where money is flowing into and out of. Normally, these performance changes signal a change that lasts several weeks.
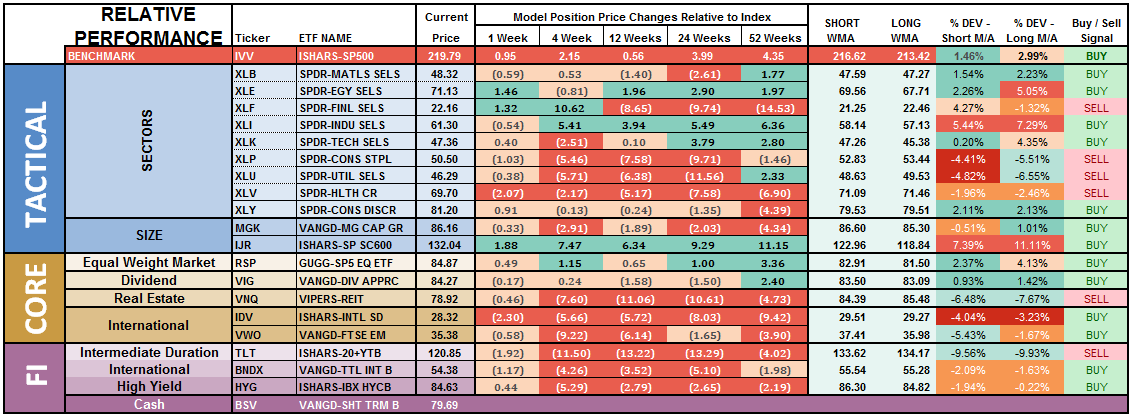
The broad spectrum of underperformance in recent months now beginning to improve somewhat, and the best opportunities are likely to come from a reversal trade as assets flow from “risk” back to “safety.” This will likely occur during the first two weeks of December.
Notice in the next to the last column to the right, the majority of sectors which have previously been pushing extreme levels of deviation from their long-term moving average, have corrected much of those extremes. Furthermore, previously all areas were on long-term buy signals but continued weakness in the markets, combined with a loss of momentum, have eroded much of the previous strength.
There is a broad deterioration across sector performance which suggests overall weakness in the markets will likely continue in the near-term. Some caution is currently advised as the market has now been split distinctively between the “risk on” and “safety” trade as shown below in the “spaghetti” chart, via StockCharts.
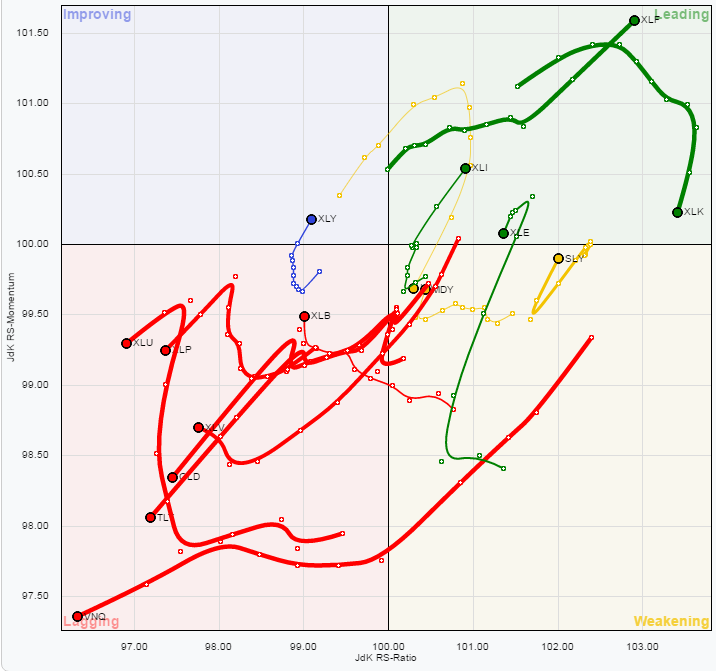
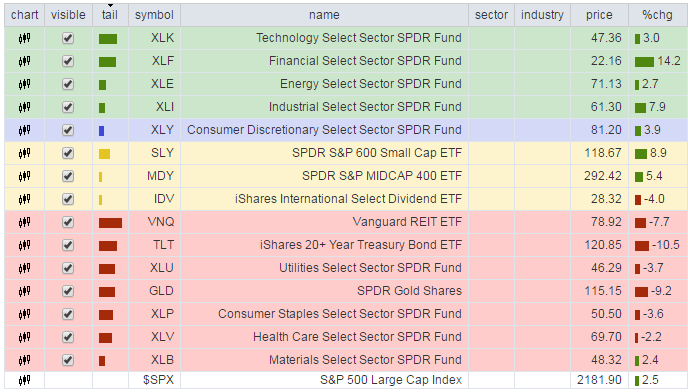
Utilities, REIT’s, Staples, Materials, Bonds, Gold, and Healthcare have remained under pressure this past week.
Importantly, notice the cluster of assets that are grossly underperforming the S&P 500 currently. THIS DOES NOT LAST LONG and tends to historically lead to rather swift reversions in the trade. Everything is currently pointing to this being the case so profit taking and rebalancing is strongly advised.
As I have stated over the last couple of weeks:
“With the rise in rates largely done, sectors with the most benefit from falling rates look reasonable.
The opposite holds true for those sectors that are adversely affected by a stronger dollar higher rates. With dollar headwind still intact, and the rate rise grossly extended, profit taking in Small-Cap, Mid-Cap, Emerging Markets, International and Energy stocks seems logical. “
While the rise in rates this past week due to the unexpected victory by Donald Trump in the Presidential election, it has only served to reinforce positioning in lagging areas of the market for a “reversion” trade over the next few weeks.
Also, as I stated last week:
“I have been recommending taking profits in the Technology sector. This was due to the extreme levels of outperformance of that sector which has begun to fade. The rotation out of technology is likely not complete yet and brings into focus extremely oversold sectors such as Health Care, Utilities and Staples as potential candidates.”
That advice remains this week as well.
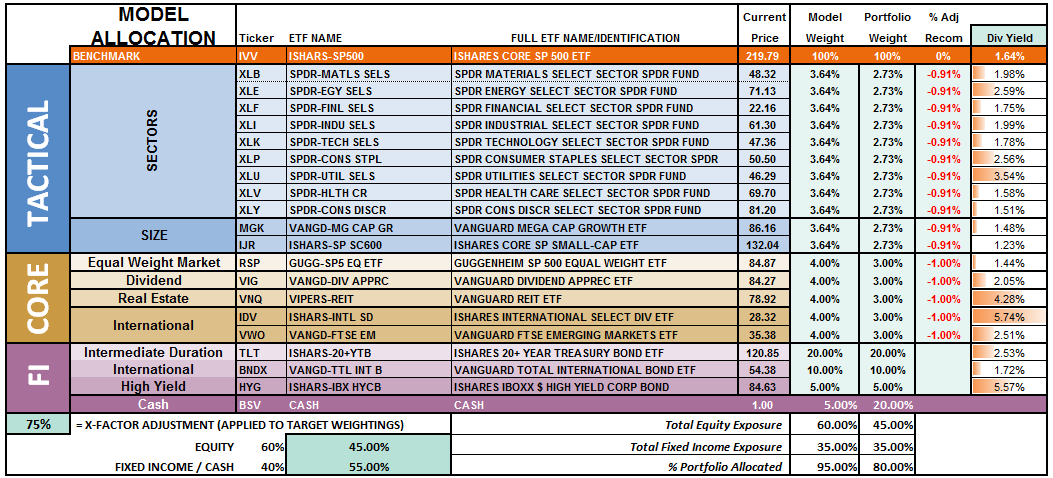
The risk-adjusted equally weighted model has been increased to 75%.However, the markets need to break above the previous consolidation range to remove resistance to a further advance.
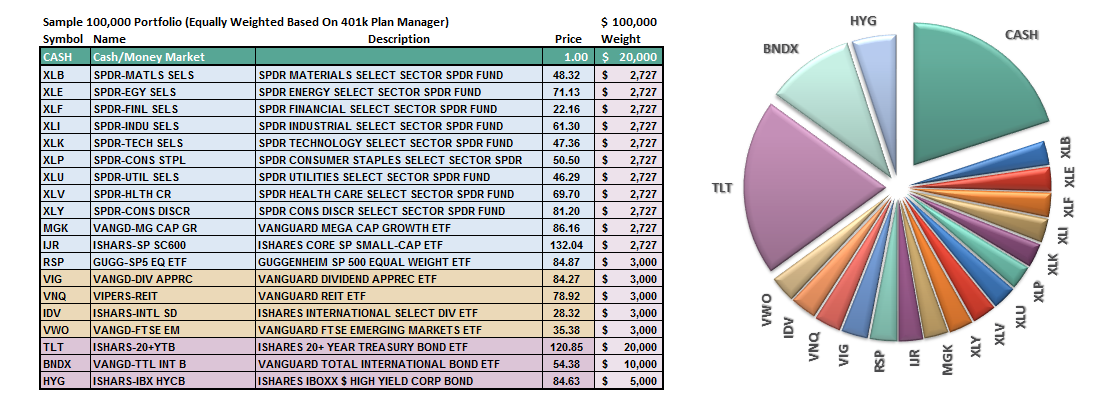
Such an increase will change model allocations to:
- 20% Cash
- 35% Bonds
- 45% in Equities.
As always, this is just a guide, not a recommendation. It is completely OKAY if your current allocation to cash is different based on your personal risk tolerance, time frames, and goals.
For longer-term investors, we still need to see improvement in the fundamental and economic backdrop to support the resumption of a long-term bullish trend. Currently, there is no evidence of that occurring.
THE REAL 401k PLAN MANAGER
The Real 401k Plan Manager – A Conservative Strategy For Long-Term Investors
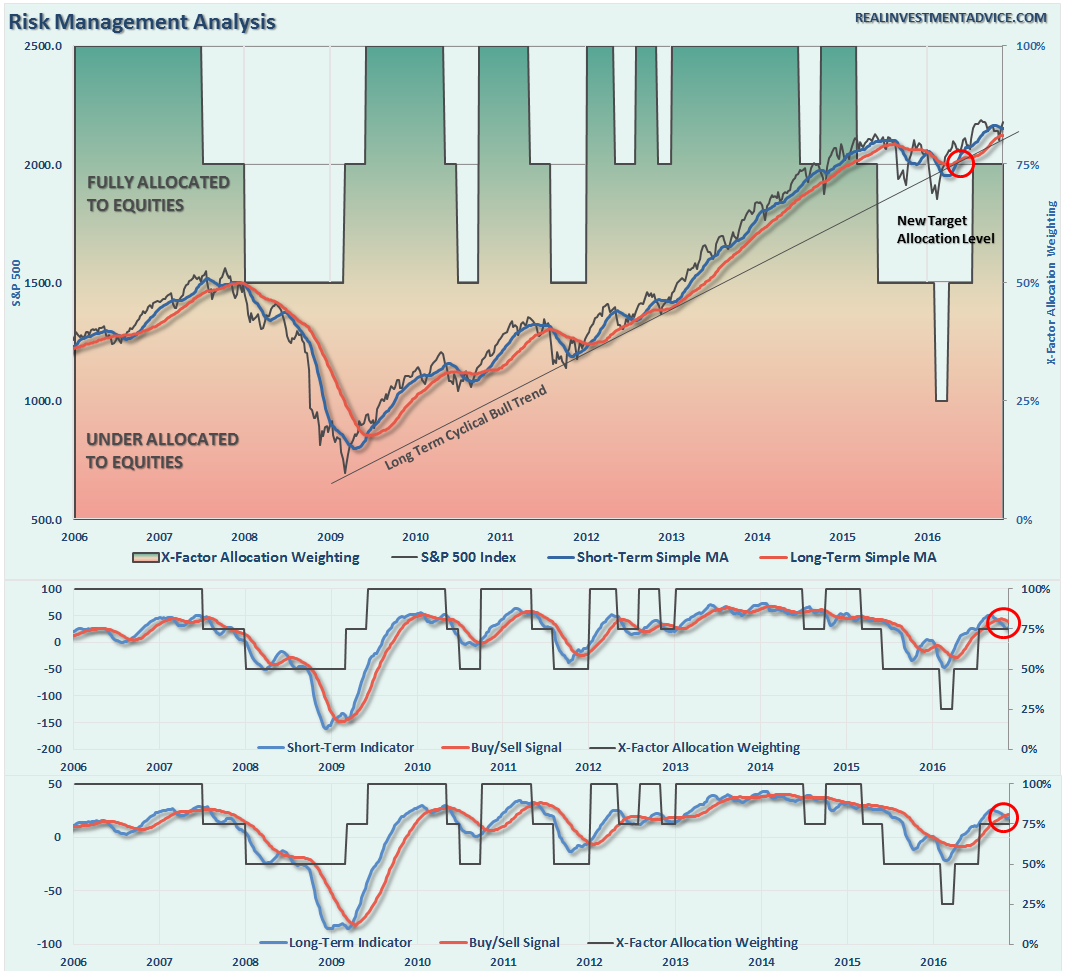
There are 4-steps to allocation changes based on 25% reduction increments. As noted in the chart above a 100% allocation level is equal to 60% stocks. I never advocate being 100% out of the market as it is far too difficult to reverse course when the market changes from a negative to a positive trend. Emotions keep us from taking the correct action.

Pay Attention
As stated above, and last week, the markets not only reversed the breakdown, and rallied this week as I suggested in last week’s missive, it also broke back above the downtrend resistance and tested all-time highs.
That’s the good news.
The bad news is, this rally is likely done for the moment and we need to wait for confirmation of the breakout before increasing equity exposure as we head into the seasonally strong period of the year.
As I stated last week, now reversed:
“By the time breaks of major support occur, and signals are registered, the markets tend to be grossly oversold. This is the case now and suggests a rally will likely ensue next week.”
Use the rally from last week to clean up portfolios as detailed in last weekend’s missive.
The big risk in the near-term is when the markets come to grips with the rise in rates, simultaneously with a stronger dollar, which will quickly erode earnings in an already over-valued market. IF the Fed hikes rates in December, we could well see another January swoon as we saw this year as much of the backdrop is still extremely weak.
The lower allocations to “risk” in portfolios has lowered volatility and kept principal safe over the last several months. Once we can get past the election and get some clarity when can start making decisions about the “seasonally strong” period of the year.
However, as noted in the chart above, we have now triggered a secondary “sell” signal that keeps us on alert. As stated last week:
“We are dangerously close to triggering a second sell signal, the bottom part of the chart, which will likely coincide with a failed rally attempt over the next week or two. Such an outcome would suggest a weaker market environment in the intermediate term with a high degree of caution required.”
If you need help after reading the alert; don’t hesitate to contact me.
Current 401-k Allocation Model
The 401k plan allocation plan below follows the K.I.S.S. principal. By keeping the allocation extremely simplified it allows for better control of the allocation and a closer tracking to the benchmark objective over time. (If you want to make it more complicated you can, however, statistics show that simply adding more funds does not increase performance to any great degree.)

401k Choice Matching List
The list below shows sample 401k plan funds for each major category. In reality, the majority of funds all track their indices fairly closely. Therefore, if you don’t see your exact fund listed, look for a fund that is similar in nature.

Disclosure: The information contained in this article should not be construed as financial or investment advice on any subject matter. Streettalk Advisors, LLC expressly disclaims all liability in ...
more


thanks for sharing