
Dividend Payers Trouncing Non-Payers Through April
If one facet of the market that has become clear this year is that companies paying a dividend are being rewarded. The below table shows data reported by S&P Dow Jones Indices on the average performance of dividend payers in the S&P 500 Index versus their non-paying counterparts. Year to date through April the payers average return return equals 6.51% versus the non-payers return of .89%. The spread is even wider for the 12-month period with the payers returning 1.66% and the non-payers return equaling -7.29%.
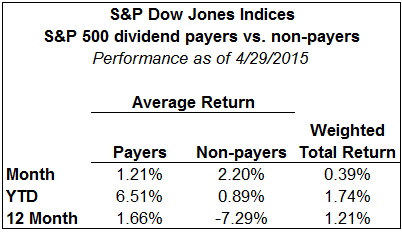
Data source: S&P Dow Jones Indices
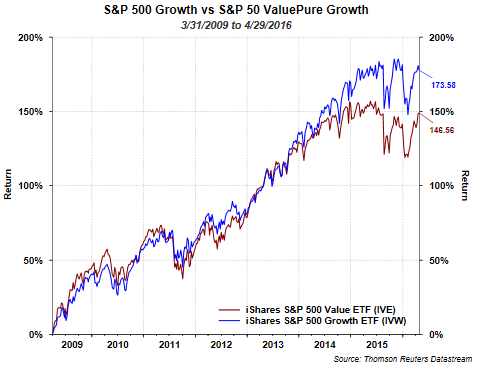
We have noted the propensity by investors to favor the payers over the non-payers of late. Yesterday's post on the Dogs of the Dow 2016 performance is a version of this theme. Not that all value stocks need to be dividend payers, but the iShare S&P 500 Value ETF (IVE) has a dividend yield of 2.35% versus the iShares S&P 500 Growth ETF (IVW) yield of 1.52%. As can be seen in the below chart, value is leading growth so far this year as well.

In this low rate world it seems dividend paying stocks are gaining some respect by investors. In a slow growth economic environment though, companies that can grow earnings in spite of the economy's anemic growth rate (growth stocks) have historically performed well. Since the end of the financial crisis both growth and value tracked pretty closely up until the end of 2013. For the last two plus years though, growth has led value in performance. Maybe the tide is beginning to turn in favor of value though.
Disclosure: None


