
Chart Of The Week: Corporate Bonds Go Vertical
You don’t often see a move like this in a bond market. This the long term, high grade corporate bond ETF from SPDR, up 6.6% in the last month.
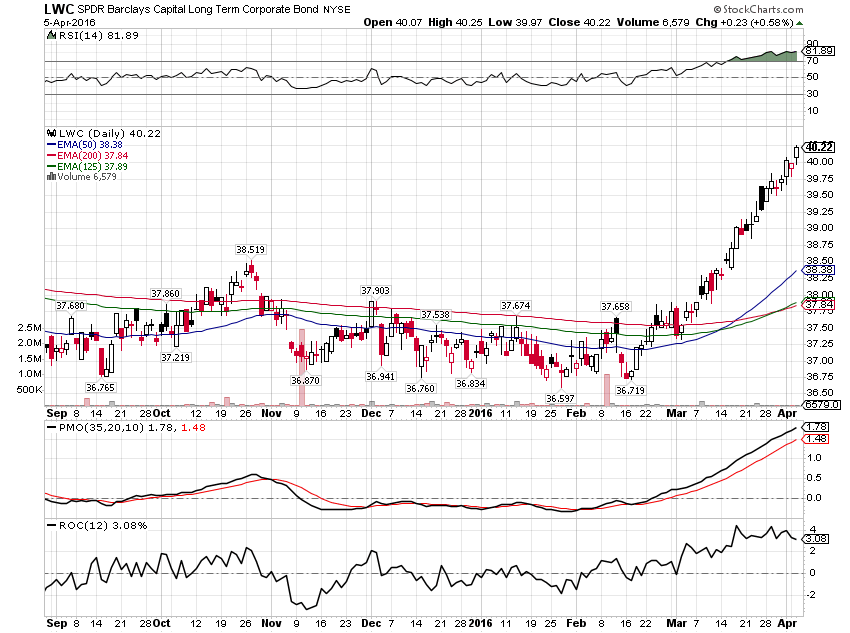
I chose this chart because of what it shows about modern markets, which don’t allow for much introspection on the part of investors. We’re all traders now and when the momentum hits an asset you better get on or you’ll miss the ride entirely. I don’t know of any massive change in fundamentals for long term (13 year duration), investment grade (90% A and BBB) bonds over the last month that would account for a 6.5% move.
So, what makes something normally sedate like this move that much? There doesn’t appear to be any significant short interest in LWC itself but maybe there were shorts in the underlying bonds that needed covering. Or maybe it is a function of bond market liquidity which is a problem for buyers and sellers. This was across the board in investment grade corporate bond ETFs so it isn’t anything specific to LWC.
Whatever the cause, I think one ought to tread carefully here. Vertical moves like this is are generally unstable and subject to quick reversals.
Disclosure: This material has been distributed for ...
more

