
Asset Class Performance MTD, QTD, And YTD 2018
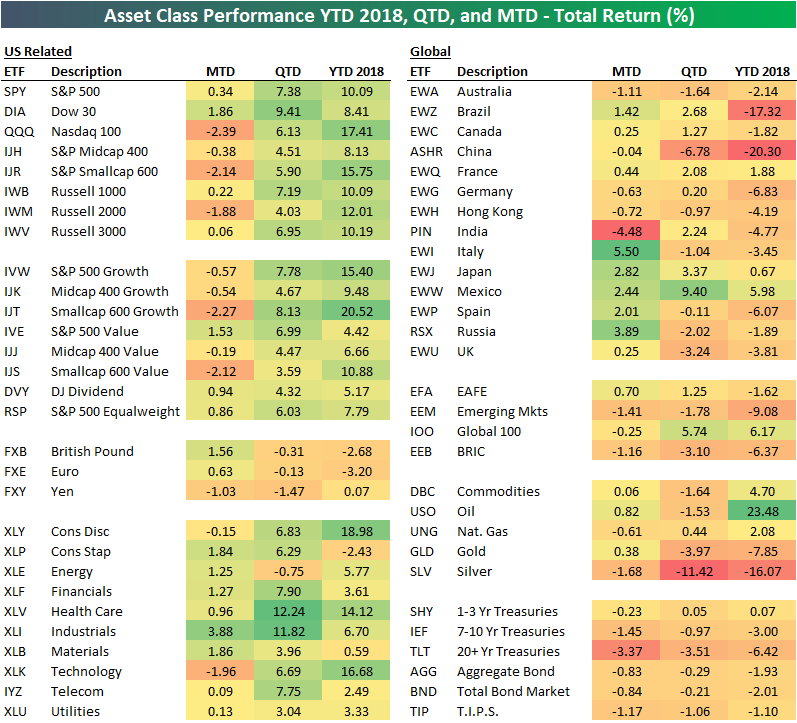
Below is an updated look at the performance of various asset classes using key ETFs tracked in our Trend Analyzer tool. For each ETF, we show its total return month-to-date, quarter-to-date, and year-to-date.
While September has been an up month so far for the S&P 500 (SPY), we’ve seen some rotation out of the strategies that were working in 2018 prior to the start of the month. You’ll notice that areas like the Nasdaq 100, the Technology and Consumer Discretionary sectors, and small-caps are all down in September, but they’re also the areas that are still up the most year-to-date. Conversely, the Dow 30 (DIA) has been the weakest of the three big US indices (Dow, S&P 500, and Nasdaq 100) in 2018, but it’s doing the best of the three in September.
Outside of the US, we’ve seen big moves higher for Italy (EWI), Japan (EWJ), Mexico (EWW), Spain (EWP), and Russia (RSX), while India (PIN) and Australia (EWA) have both fallen. Brazil (EWZ) and China (ASHR) remain as the worst international performers on a year-to-date basis.
The commodities ETF (DBC) is pretty much flat on the month along with oil (USO) and gold (GLD), while Treasury ETFs are down across the board. The 20+ Year Treasury ETF (TLT) has been one of the worst performing asset classes in September with a drop of 3.37%.
(Click on image to enlarge)
Disclaimer: To begin receiving both our technical and fundamental analysis of the natural gas market on a daily basis, and view our various models breaking down weather by natural gas demand ...
more

