
As The Third Quarter Ends, Largest US ETFs See Outflows
Talking Points:
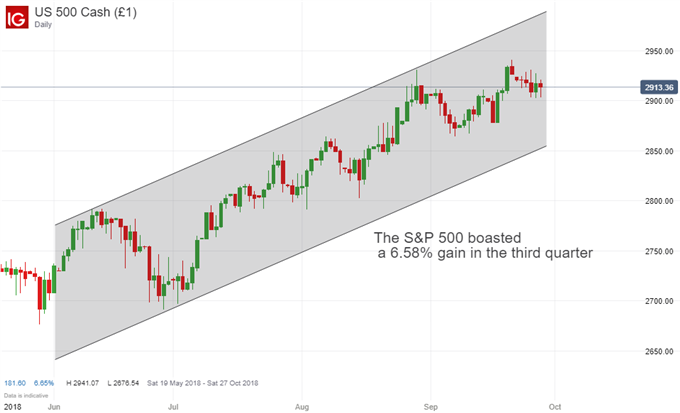
- The S&P 500 boasted its best quarterly performance since Q4 2013, growing 6.58%
- Investors pulled funds from domestic ETFs as emerging markets rebounded and the Dollar climbed
- The NASDAQ tracking QQQ ETF saw inflows, contrasting the larger basket of funds
As the week draws to a close, so too does the third quarter. Marked by robust strength in US equities and the 10th anniversary of Lehman Brothers’ collapse, the third quarter saw the most growth in the S&P 500 since the fourth quarter of 2013.
S&P 500 Daily Price Chart June 2018 – October 2018
Despite the strong performance of US equities and general risk-on mood this week, investors moved funds from exchange traded funds with US exposure. As we have covered previously, SPY, VOO, and IVV track the performance of US large-cap corporations.
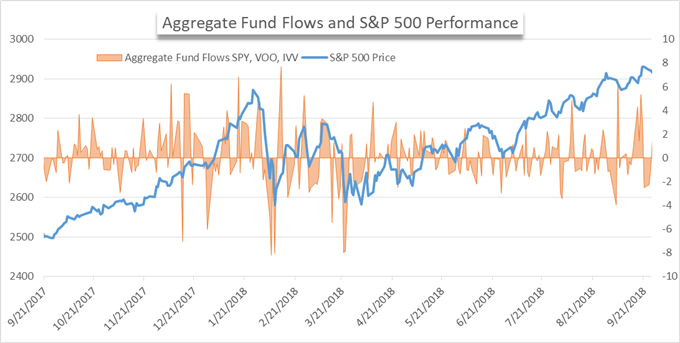
At the quarterly level, the three funds saw $157 billion in inflows. Compared to their cumulative market capitalizations (roughly $1 trillion) and the week-to-week changes, the change in exposure quite large. The second quarter saw a net inflow of $34 billion, a figure significantly dwarfed by the third quarters. The willingness to have US exposure suggests investors are still confident in the bull-market heading to the year’s end.
On a smaller scale, the three ETFs saw an aggregated $16.13 billion flow elsewhere for the week. After last week’s robust inflows it is not entirely surprising to see moderate outflows this week. Profit-taking could be a possible reason for the change, along with more attractive opportunities elsewhere.
QQQ ETF Price Chart 1-Year
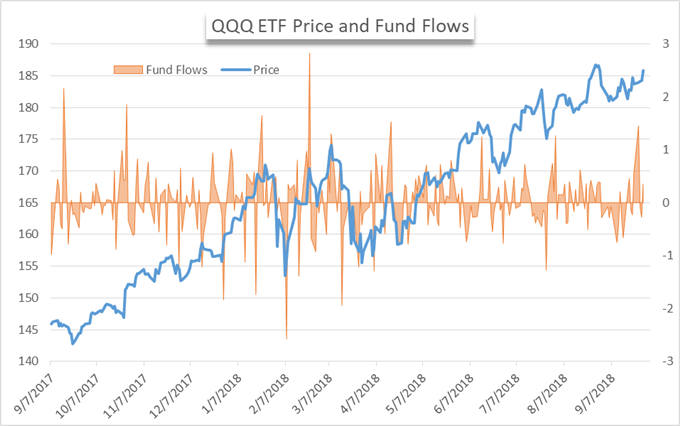
One such opportunity was the tech-heavy NASDAQ. Of the three main US equity markets, NASDAQ was the sole market to post gains for the week. Incidentally or perhaps consequently, the NASDAQ tracking QQQ ETF saw net inflows. Year to date, the NASDAQ still outpaces all other indices, up roughly 11%.
US Dollar Basket Price Chart 1-Hour, September 24th – 28th
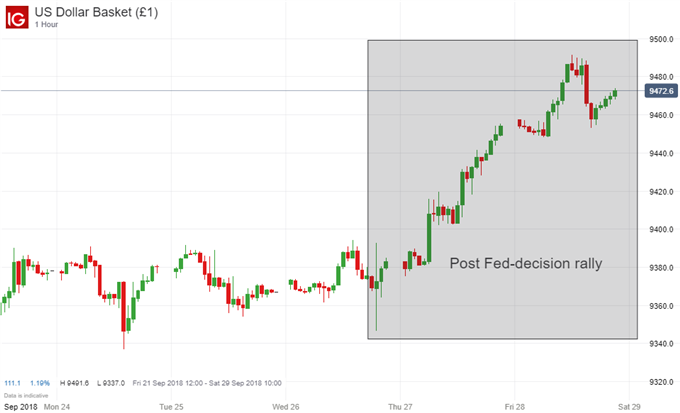
Besides profit taking, another potential reason for the outflows is a strengthened Dollar. Following the Fed’s rate decision, the Dollar rallied higher in the tail end of the week. Further, comments from Fed Chairman Powell on the ‘near record level’ valuation of equities could have engendered minor equity averse sentiment for some traders.
Headed into next week the economic calendar suggests ISM manufacturing data and non-farm payrolls will be the most dominant data pieces. Coupled with trade negotiations, we could have a bumpy first week in the new quarter and that could spur more drastic fund flows.
Disclosure: Join our analysts for Live Webinars as they cover the impact economic data pieces ...
more

