
Beleaguered Oil Stocks Are Testing Important Support Stretching Back 3 Decades: What Happens Next?
Beleaguered oil stocks are testing important support stretching back 3 decades. Will they hold the trendline again and resume their leadership that they displayed throughout 2016 or is the repeated testing of the trendline wearing it down, leaving it destined to fail sooner than later?
Written by Dana Lyons
It’s no secret that while the broad equity market has fared pretty well so far in 2017, oil stocks have taken it on the chin. If we compare sector performance via the SPDR ETFs, not only is the Energy SPDR (XLE) the worst performer, but it is the only one in the red for the year. Not only is it down, but it is down some 9.5%. Then again, XLE did lead the way among the sectors in 2016, gaining almost 25%, so some giveback is not abnormal, nor is it necessarily unhealthy in the long run. That is unless the giveback results in the sector threatening to break a key line of support stemming from 3 decades ago.
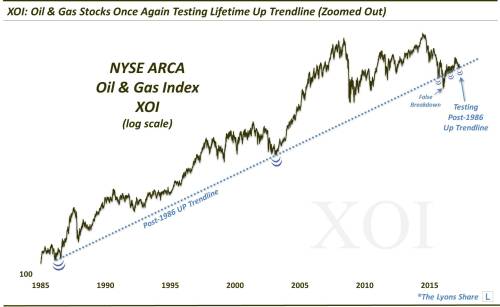
In this case, we are referring to the NYSE ARCA Oil & Gas Index (XOI). With its inception back in 1984, the XOI is one of the oldest indices tracking oil stocks and, throughout most of its 30+ year lifespan, it has been supported by a rising trendline stemming from its low in July 1986. This trendline (drawn on a log scale) connects the lows in 2003 as well as those in August-September 2015.
As stock market losses accelerated to begin 2016, the XOI finally broke down below the post-1986 trendline. Just 2 months later, however, at the beginning of March, the XOI would rally back to reclaim the trendline once again. Over the remainder of the year, the XOI would go on to test the trendline at least a handful of times...
As stated, each of the XOI’s tests of its post-1986 Up trendline over the final 10 months of 2016 proved successful, i.e., the XOI held above the trendline. Following the U.S. election last November, the XOI was finally able to increase its rally trajectory and put some meaningful space between it and the trendline. It would not last, however.
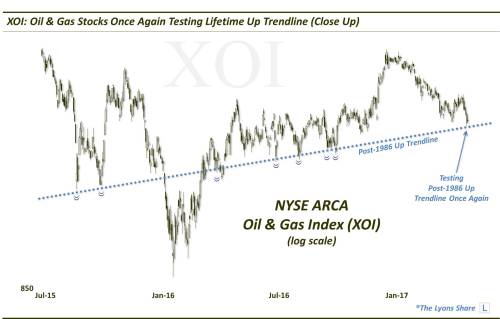
After a steady 3 and a half months of declines to begin the year, the XOI once again finds itself testing its lifetime Up trendline, currently near the 1140 level.
Here’s a view from closer up (notice how the index has “respected” the trendline over the past 18 months):
What now?
- Will oil stocks hold the trendline again and resume their leadership that they displayed throughout 2016?
- Is the repeated testing of the trendline wearing it down, leaving it destined to fail sooner than later?
...[The answers to the above questions are] to be determined but there are some additional measures of support that may serve to bolster the XOI’s chances of holding this long-term “line in the sand” support…at least for now.
This article may have been edited ([ ]), abridged (...) and reformatted (structure, title/subtitles, font) by the editorial team of munKNEE.com (Your Key to Making Money!) to provide a ...
more

