
The Velocity Of Money Has Been Declining In The U.S., But Don’t Worry About It
“Basically, the decline in the velocity of money is due to math rather than economic dysfunction, and it's not necessarily a signal of economic trouble.” (The Independent Market Observer, Feb 9, 2017)
The velocity of money, which is the ratio of GDP to the stock of money, is often regarded as an important indicator of the performance of the economy. In terms of rates of change, the velocity of money is a function of how fast the economy is growing relative to the growth in the money supply. In other words, the velocity of money measures the rate at which money in circulation is used to purchase goods and services.
In the U.S. the velocity of money has been rather unstable and its link to inflation has also been very uncertain.
Of course, part of the problem with understanding the velocity concept relates to measurement issues. That is, what specific money supply indicator should be used in the calculation of the velocity of money?
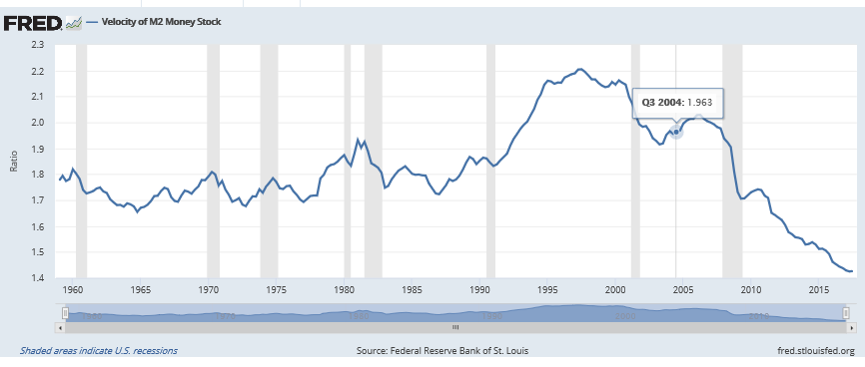
In this discussion and in the following chart, we have chosen to focus on the M2 version of the money supply. M2 represents cash in circulation plus saving and checking deposits at the commercial banks.
As noted in a recent Investopedia article (October 20, 2017) and as seen in the following chart, between 1959 and the end of 2007 the velocity of M2 money stock averaged 1.86 with a maximum of 2.21 in 1997 and a minimum of 1.66 in 1964.
Clearly, the Great Recession and its aftermath affected the course of the U.S. velocity of money.
As the following chart illustrates, since 2007 the M2 velocity measure has fallen dramatically as the Federal Reserve massively expanded its balance sheet in order to combat the global financial crisis and to offset world deflationary pressures.
In recent years the Fed stabilized its balance sheet, which seemed to slow the decline in the velocity of money.
(Click on image to enlarge)
Should we worry about a declining velocity of money? The economist answer is that a declining velocity of money is only a problem if it reflects a slowing or a declining U.S. economy.
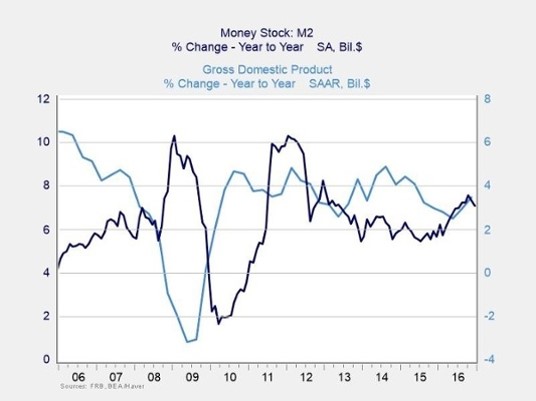
But one can see from the second chart that over the past 10 years, money supply growth and GDP growth have trended in opposite directions.
When GDP growth was weak, the money supply grew faster, and when economic growth accelerated, the money supply grew more slowly. The chart also indicates the growth in the M2 money supply growth only spiked higher in two periods over the past ten years, in the aftermaths of the 2007-08 financial crisis and the European crisis in 2011. In recent years M2 and nominal GDP have grown at rather similar rates.
Disclosure: None.


Because of IOR reserves are just sitting. Inflation is below normal. Deflationary pressures are not out of the question, right Prof?