
The Inconvenient Truth Behind Donald Trump’s Victory
Following the Brexit vote in late June and passionate support for the Bernie Sanders campaign, the Presidential election of Donald Trump provided yet another sign that the American people, as well as many around the world, are increasingly demanding a new economic path. This piece is not written to opine on the election or the merits of Donald Trump. The intent is to highlight, through the use of a few charts, that the nation’s economic policy for the last 30 years has failed greatly and hollowed out the middle class. The consequences have been accumulating for years but have been camouflaged by ever increasing, but unsuccessful attempts to reignite economic growth.
The graphs below provide evidence that despite the narratives of the Federal Reserve, media pundits and most policy wonks, the economy is failing most Americans. While there are many ways to show the deterioration of the U.S. economy and the consequences endured by its citizens, we selected charts we deem to be the most telling.
We hope that no matter who you voted for, you study these graphs to better understand the impetus behind Trump’s victory. More importantly, we hope this helps everyone better grasp why economic policy must change before the consequences become dire.
As a supplement to these charts, we highly recommend reading or re-reading our important article “The Death of the Virtuous Cycle”. In that piece we identify and diagnose what we consider the most significant issue facing the United States and other developed market economies.
Income and Debt
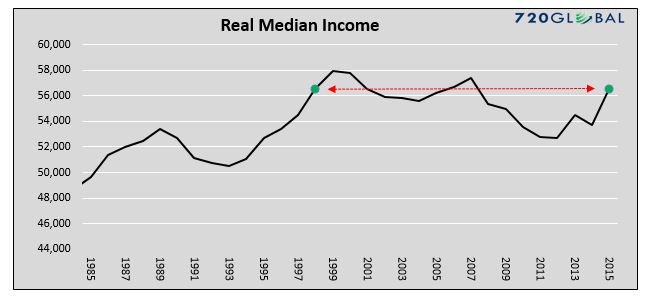
Real Median Household Income is at the same level today as it was in 1998.
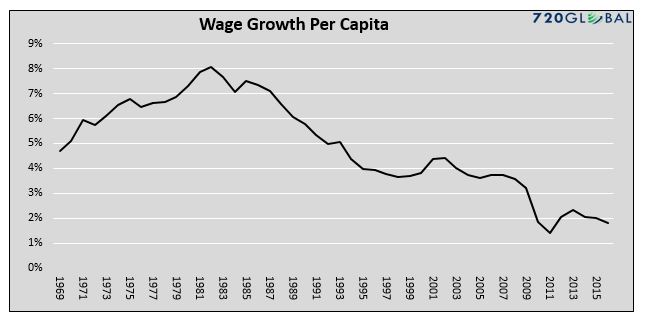
The ten-year average growth of wages has been declining for over 35 years.
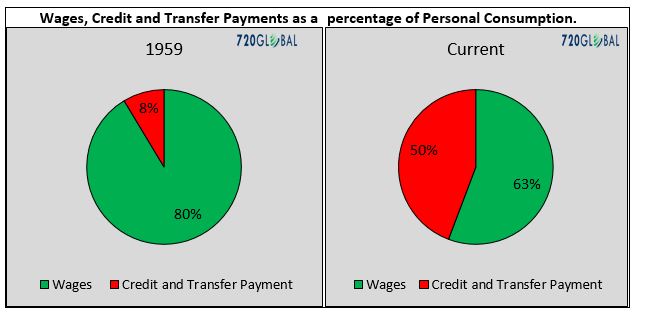
Personal consumption (PCE), accounting for approximately 70% of GDP growth, has grown heavily reliant upon debt and transfer payments as wages are not sufficient to meet consumers demands. Transfer payments are payments from the government to its citizens. (Note: The numbers above do not add to 100% as there are other sources of consumption and wages are not entirely consumed.)
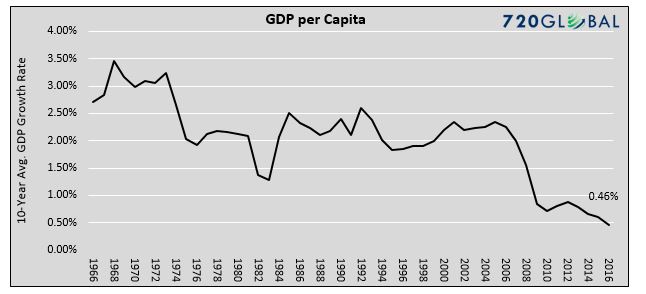
Secular economic growth (GDP) per capita has been in decline for the better part of the last 40 years. This helps explains the weakness in consumers’ wages and the increased dependency on credit and transfer payments.
Labor
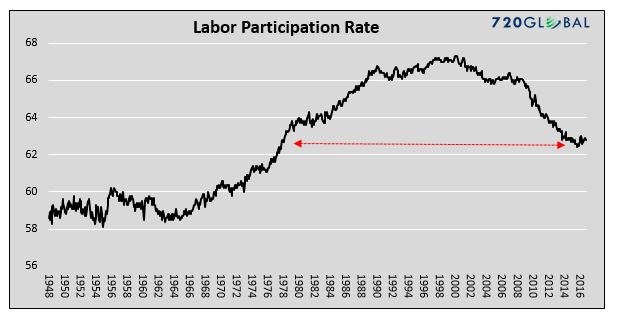
Almost 95 million eligible workers are currently out of work. As a result the labor force participation rate has decreased over the last 16 years to levels last seen in the 1970’s.
Productivity
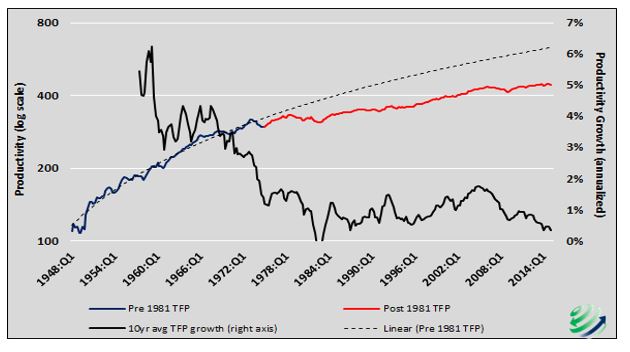
The productivity (TFP) growth rate (black line) has been declining since the 1970’s and will likely turn negative in the next year or two. A lack of productivity growth results in weaker economic growth, a heavy price inordinately borne by employees.
Trade Deals
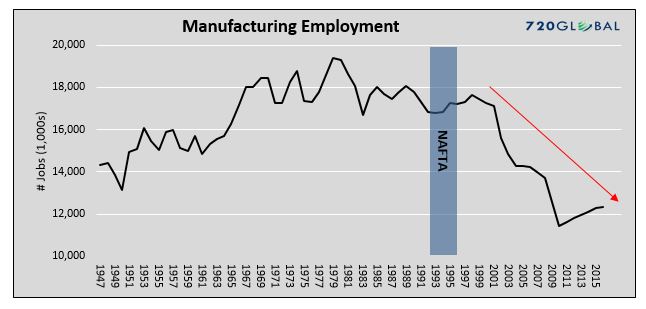
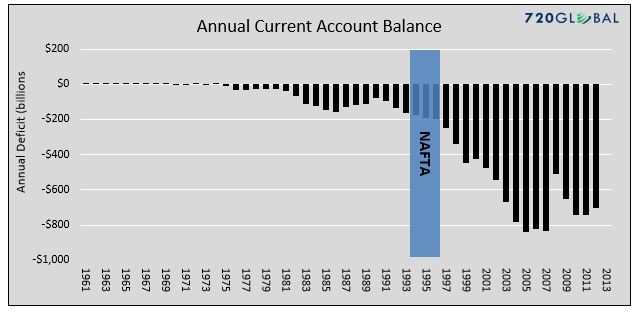
Trade deals, such as NAFTA (1994), make it easier for U.S. corporations to outsource jobs to foreign nations offering cheaper labor. As a result, the U.S. has lost millions of manufacturing jobs and significantly worsened the annual current account deficit.
Wealth and Income Inequality
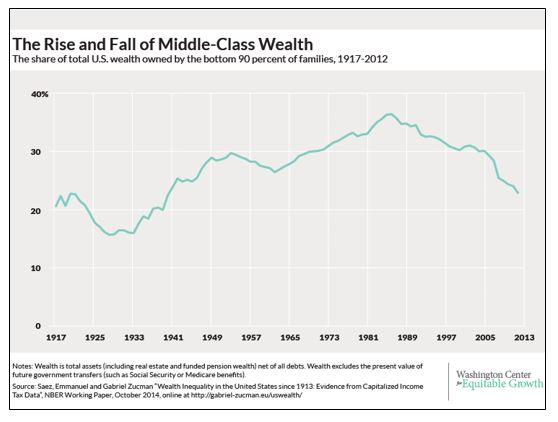
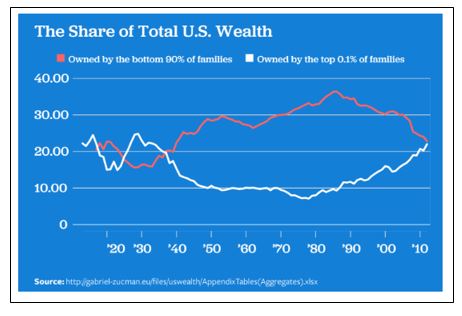
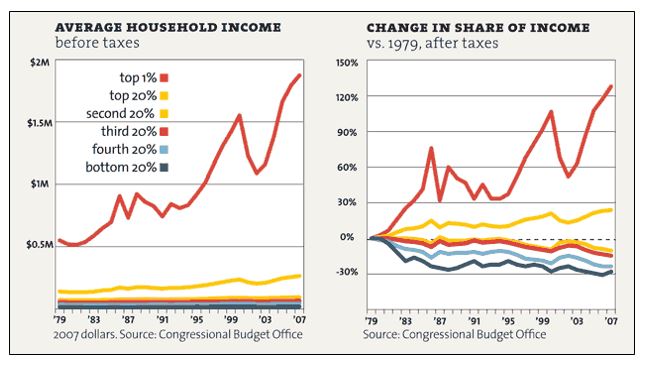
Years of poorly designed economic and monetary policy have resulted in the redistribution of wealth from the middle class to the so called “1%”.
We summarize with an apt tweet from Binyamin Applebaum of the New York Times:

The data for all graphs was courtesy of the Federal Reserve unless otherwise noted.
Disclosure: Opinions expressed herein are current opinions as of the date appearing ...
more

