
So Much Good News….Just Ignore Politics
“Davidson” submits:
One of most intense arguments, ongoing for this cycle, has been hourly wage growth and which political party is doing the most to help employees. One party is even claiming a 10% reduction in wages has occurred due to the new tax law. Any guesses from which party this statement emanated? Politicians have long claimed their actions provide immediate benefits while the opposing party’s actions are hurtful. The economic data has long history. While politicians have some influence, that influence comes mostly from imposing broad policy agendas on the economy which more often than not takes years to impact economic activity. Politicians do not influence economic activity quarter-over-quarter and policies have never had the effects for which they were designed. It is better to ignore the political rhetoric and focus on the data.
Each economic cycle differs uniquely from past cycles. One has to identify the themes as they develop if one is to invest with any expectation of a reasonable outcome. Several data series are useful guides in sorting through an always confusing environment of ‘He said…She said’.
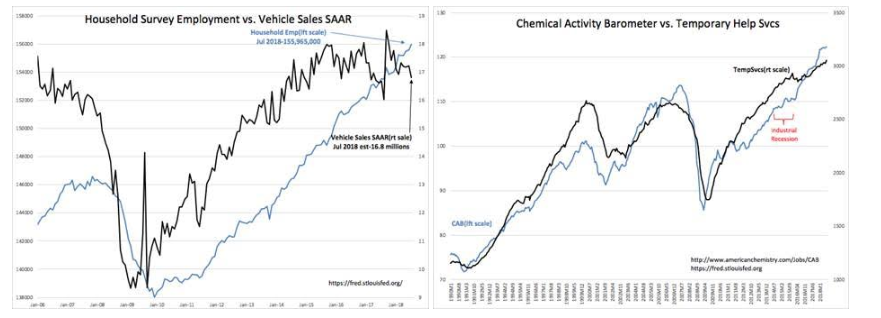
1st: two charts-Household Survey Employment vs. Vehicle Sales SAAR and Chemical Activity Barometer vs. Temporary Help Svcs
Employment trends lag economic upturns, rising only after economic activity has turned higher. Employment trends are not good for identifying stock market upturns. But, employment growth stalls prior to economic peaks and is good at forecasting potential recessions and market peaks. Vehicle sales as SAAR( Seasonally Adjusted Annual Rate) are good at identifying early uptrends in economic activity which in turn makes this data good for identifying stock market upturns. But, once most consumers have replaced older vehicles, Vehicle SAAR typically can stall for several years even as economic expansion continues. Vehicle sales are not helpful identifying economic or stock market tops.
Associated with vehicle sales and employment are the Chemical Activity Barometer(CAB) and Temporary Help Svcs data. This data complements other employment and manufacturing series. The CAB has a much tighter correlation to economic activity and is very good at forecasting the broad stock market cycle. The recent new high levels in both forecast continued economic expansion.
In the argument of ‘He said…She said’, this data decidedly underlines that a strong economic expansion continues. The weakness in employment or economic trends has no support.
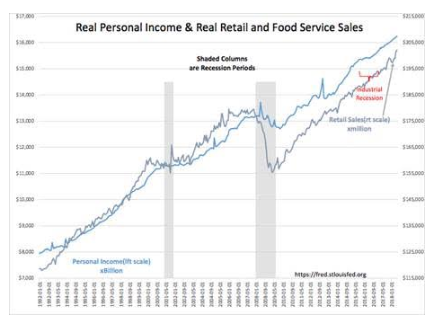
2nd: Real Personal Income & Real Retail and Food Service Sales
Real Retail and Food Service Sales provide a broad picture of consumer spending. Like vehicle sales, this series is an early indicator of economic upturns but stalls well before economic and stock market peaks. The value to monitoring this data is that it provides confirmation to other data. Real Personal Income shows a steady rise which is why Retail and Food Service Sales series is rising, but has not stopped a vehement argument as to whether the ‘working poor’ are left behind and a min-wage should be mandated (or not).
In any economic cycle in any society, there will always be some segment, however small, who is not participating. The broad spectrum of human personality always has some who do not participate fully. Steven Pinker’s, “The Blank Slate”, 2002, speaks to DNA inherited traits which make each of us unique, individuals with individual talents and inclinations, which produces differing outcomes. This is not an issue which can be remedied by political policy. Even so, since the implementation of the new tax law, there has been a notable rise in Real Retail and Food Service Sales data on a steady increase in Real Personal Income. Tax reduction will have that impact. It is that noticeable!!
In the argument of ‘He said…She said’, this data decidedly identifies that a strong economic expansion continues. Weakness argument in personal income/wage growth, retail sales or the economic trend has no support from this data.
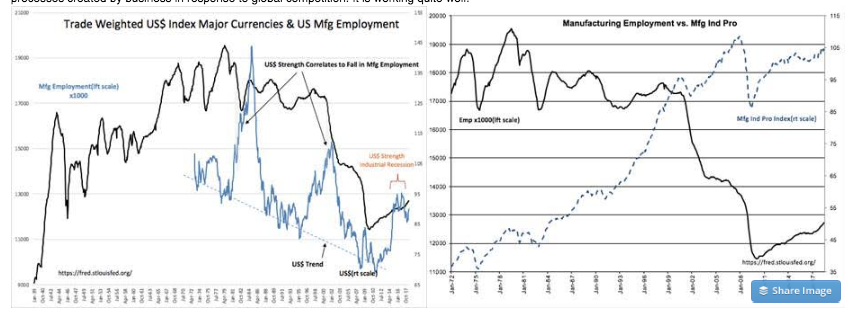
3rd: two charts-Trade Weighted US$ Index Major Currencies vs US Mfg Employment and US Manufacturing Employment vs. Mfg Ind Pro
Lost in the perception on all sides has been a significant change in compensation. This was mentioned several years ago in these notes, titled the “Leaning of US Manufacturing”. Understanding our economy requires placing all within the context of globally significant policies and events, layers interacting with layers, which requires one to be sensitive to unexpected responses. One of these responses initiated by Danaher(DHR) in the mid-1980s was a program of employee engagement and manufacturing processes referred to later as ‘lean’. It is the process of management working hand-in-hand with employees as if they are all in the same lifeboat in which success or failure impacts all equally. Part of this, hidden from hourly wage data, has been employee bonuses from on going profit sharing in the range of 10%-15% of Operating Income(pre-tax). The US Department of Labor established to benefit employees vs. Big Business has traditionally focused on union benefits and hourly wage growth with employee bonuses not deemed a typical or relevant form of compensation. In ‘lean’ operated businesses, there is high reliance on employees to operate individual work spaces profitably, safely and with high quality control. Success is rewarded with cash bonuses and ongoing participation in corporate profitability. None of this is monitored by the Dept of Labor. Nonetheless, the financial impact of ‘lean’ on Real Personal Income is reflected in the data and is why so many today continue to be surprised by strong Real Retail and Food Svc Sales even with less than stellar growth in hourly wages. This recent article discusses the impact ‘lean’ has had on personal income growth and well worth reading to understand the value of looking beneath the data to comprehend how the business, employment and compensation format has changed.
Tax-cut bonuses won’t last, but profit sharing pays off big at TI, GM and Southwest Airlines
The charts Trade Weighted US$ Index Major Currencies & US Mfg Employment and US Manufacturing Employment vs. Mfg Ind Pro are instructive in tracking the genesis of ‘lean’. The data shows that rises in levels of the US$(US Dollar vs Trading Partner Currencies) results in declines of US Mfg Employment. The US$ shifts higher whenever global conditions cause investors to favor the perceived returns/safety of US$ based assets. In the early 1980s the rise was due to Fed Chairperson Volcker’s 18% rates to stop an inflationary spiral and in the late 1990s the rise was due to investors chasing the Internet Bubble. More recently, 2014-2016, investors feared the rise of terrorism and threats to Democratic principles from Russia, China, No Korea and Iran. Each US$ rise resulted in a decline in US manufacturing, exports and US Mfg Employment. These periods created discounts in overseas manufacturing which caused US manufacturers to make capital decisions shift manufacturing capacity internationally. In the mid-1980s, Danaher met these challenges when Art Byrne developed what is now known as the Danaher Business System(DBS). John Krafcik coined the term ‘lean’ in 1987.
Jim Womack recalls:
“We came up with that term in ’87 when we needed a name for what we were seeing…It uses less time to go from concept to launch, less time to go from raw material to customer, and it uses less effort, less hours of engineering to do product development, less hours of human effort in the factory. There’s fewer suppliers and they’re fewer injuries. Well, actually were. There’s less inventory. Well, yeah, there was. There are fewer defects, less defects. By the way, you can make money at lower volume because of the ability to flexibly change over form one product to another. Less, less, less, less, less.”
Then, John (John Krafcik) got his moment of fame, by saying, “I’ve got it. Let’s call it Lean.” https://soundcloud.com/mark-graban/jim-womack-on-the-word-lean
These charts reflect the advent of ‘lean’ and its gradual shift into US manufacturing as Danaher managers left to become CEOs elsewhere and made their marks across US industry. The problem with economics and market analysis today is that current approaches entirely miss the complex dynamics evolving over time behind the numbers. Economics and markets reflect a continuously evolving and vibrant history of many cultures seeking better standards of living. Global capital shifts resulted in periods of US$ strength. In turn, this produced industrial recessions even in the middle of economic upcycles. US manufacturers responded with ‘lean’. Then in 2001, China joined the World Trade Organization(WTO) during a period of US$ strength. This combination helped spur a significant drop in US Mfg Employment. In 2005, markets forced a currency devaluation on the Yuan(China’s currency) and shifted even more manufacturing to China. US Mfg Industrial Production(IndPro) historical rise slowed after 2001 as China gained. From 2001, US Mfg Ind Pro rose more gradually with US Mfg Employment finally turning up in 2009 as ‘lean’ hit enough of a critical mass for a general employment improvement. 2009 was the first general improvement since the 1980s. There was a pause 2014-2016 with the last rise in the US$, but now US Mfg Employment appears in a decent uptrend. US Mfg IndPro now at 105 is 130% higher than 1983’s level of 45 while US Mfg Employment has fallen ~30% from 17.916mil to 12.713mil today. Doing more with less!
One needs to study the story behind the data if the data is to make sense. It appears that US Mfg Employment has been recovering since 2009 and this was due to ‘lean’ processes developed at Danaher in 1985.
In the ‘He said…She said’ of who did what to whom, in my opinion what we have seen is simply part of widening global trade with positives/negatives unassigned to any party. What can be said with support from this data is that US Mfg Employment appears in a strong uptrend. This comes self-generated through ‘lean’ business processes created by business in response to global competition. It is working quite well!
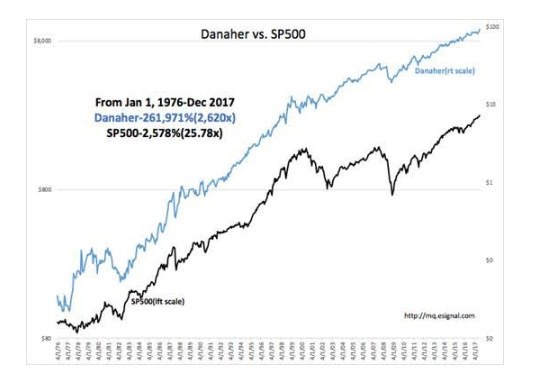
The impact on those companies which have embraced ‘lean’ is shown in the chart of Danaher vs. SP500. From Jan 1976 to Dec 2017 Danaher has risen 261,971% vs. SP500 2,568%. Danaher has out performed the SP500 by more than a factor of 100 times. Managing companies well comes only through employee engagement and appropriate compensation. The results are spectacular.
The Investment Thesis Aug 3, 2018:
Investing requires knowing how to focus in a very noisy and over-crowded room. Relying on data rather than biased opinion is the only means towards disciplined investing approach. Even then, one must evaluate the economic themes behind the data because at times the collected data does not always reflect the evolving economic themes. Case in point for this cycle, is the discrepancy between hourly wage growth and Real Personal Income. The Dept of Labor has not been geared to collect data on bonus income paid to manufacturing employees because years ago it was not deemed relevant. Today, we have political arguments and policy decisions based on misperception of what the data actually means. While economic activity is booming, many continue to complain how awful things are. What a state of misperception.
Net/net, economic expansion continues and many positive surprises lie ahead. Equity markets should respond with higher prices.
Disclosure: The information in this blog post represents my own opinions and does not contain a recommendation for any particular security or investment. I or my affiliates may hold positions or ...
more

