
Second To None: Valuations Compared With Fundamentals
“Today’s equity market valuations have only been eclipsed by those of 1929, and 1999.” Given the continuing equity market rally and multiple expansion, the quote above from prior articles, had to be modified slightly but meaningfully. As of today, the S&P 500 Cyclically Adjusted Price to Earnings ratio (CAPE) is on par with 1929. It has only been surpassed in the late 1990’s tech boom.
A simple comparison of P/E or other valuation metrics from one period to another is not necessarily reasonable as discussed in Great Expectations. That approach is too one-dimensional. We elaborate on that concept that is used to compare current valuations and those of 1999 to their respective fundamental factors.The approach highlights that, even though current valuation measures are not as extreme as in 1999, today’s economic underpinnings are not as robust as they were then. Such perspective allows for a unique quantification, a comparison of valuations and economic activity, to show that today’s P/E ratio might be more overvalued than those observed in 1999.
Secular GDP Trends
Equity valuations are a mathematical reflection of a claim on the future cash flows of a corporation. When one evaluates a stock, earnings potential is compared to the price at which the stock is offered. In most cases, investors are willing to pay a multiple of a company’s future earnings stream. When the prospects for earnings growth are high, the multiple tends to be larger than when growth prospects are diminished.
To forecast earnings growth for a company, one needs to do an in-depth analysis of the corporation, the economy and the markets in which it operates. However, evaluating earnings growth for an index comprising many companies, such as the S&P 500, is a relatively straight-forward task.
Corporate earnings are a byproduct of economic activity. Earnings growth can differ from economic growth for periods of time, but in the long run aggregate earnings growth and GDP growth are highly correlated.The two graphs below offer an illustration of the durability of this relationship. The graph on the left plots three-year average GDP growth and its trend since 1952, while the graph on the right highlights the correlation of GDP to corporate profits.
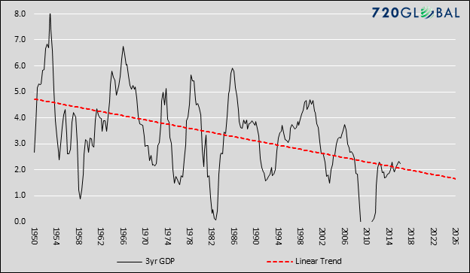
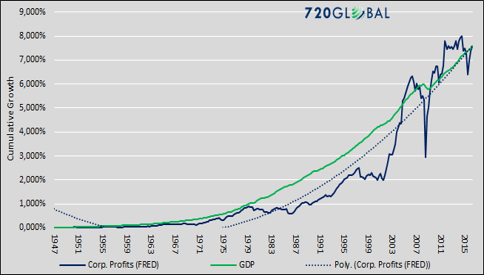
Data Courtesy: St. Louis Federal Reserve (FRED), Bureau of Economic Analysis (BEA) and Bloomberg
Given the declining trend of GDP and the correlation of earnings to GDP, it is fair to deduce that GDP and earnings growth trends were healthier in the late 1990’s than they are today. More specifically, the following table details key economic and financial data comparing the two periods.
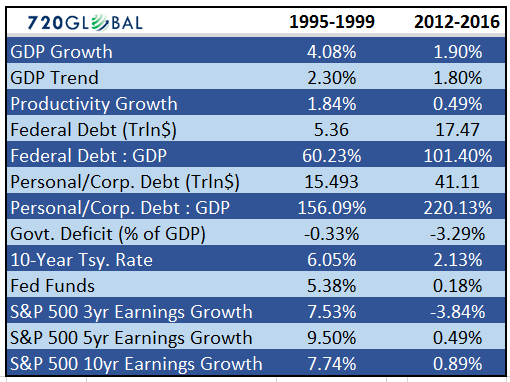
Data Courtesy: St. Louis Federal Reserve (FRED), and Robert Shiller http://www.econ.yale.edu/~shiller/data.htm
As shown, economic growth in the late 1990’s was more than double that of today, and the expected trend for economic growth was also more encouraging than today. Trailing three- five- and ten-year annual earnings growth rates contrast the current stagnant economic growth versus the robust growth of the 90’s. Additionally, various measures of debt have ballooned to levels that are constricting economic growth and productivity. Historically low interest rates are reflective of the current state of economic stagnation.
The graph below charts price-to-earnings (CAPE) divided by the secular GDP growth (ten-year average), allowing for a proper comparison of valuations to fundamentals.
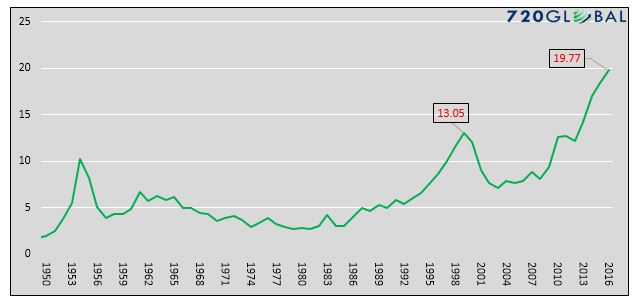
Data Courtesy: Robert Shiller http://www.econ.yale.edu/~shiller/data.htm
The current ratio of CAPE to GDP growth of 19.77 has far surpassed the 1999 peak and all points back to at least 1950. At the current level, it is over three times the average for the last 66 years.Further, based on data going back to 1900, the only time today’s ratio was eclipsed was in 1933. Due to the Great Depression, GDP at that time for the preceding ten years was close to zero. So, despite a significantly deflated P/E multiple, the ratio of CAPE to GDP was extreme. Looking forward, if we assume a generous 3% GDP growth rate, CAPE needs to fall to 18.71 or 35% from current levels to reach its long term average versus GDP growth.
Summary
Equity valuations of 1999, as proven after the fact, were grossly elevated. However, when considered against a backdrop of economic factors, those valuations seem relatively tame versus today. Some will likely argue with this analysis and claim that Donald Trump’s pro-growth agenda will invigorate the outlook for the economy and corporate earnings. While that is a possibility, that argument is highly speculative as such policies face numerous headwinds along the path to implementation.
Economic, demographic and productivity trends all portend stagnation. The amount of debt that needs to be serviced stands at overwhelming levels and is growing by the day. Policies that rely on more debt to fuel economic growth are likely not the answer. Until the disciplines of the Virtuous Cycle are understood and followed, we hold little hope that substantial economic growth can be sustained for any meaningful period. Given such a stagnant economic outlook, there is little justification for paying such a historically steep premium for what could likely be feeble earnings growth for years to come.
Disclosure: Neither 720Global, LLC nor its owners have received any form of direct or indirect compensation in exchange for the review of this book.
Within the next two weeks ...
more

