
Negative 5 Year Annualized Real Returns For S&P 500
The most interesting discussion in economics is about whether the increasing jobless claims mean the labor market is weakening and the expansion is near its end. The bearish argument is obvious. Increasing claims are a bad sign for stocks since claims increase before and during recessions. It’s not a good sign to see a leading indicator weaken. The bulls claim this is just noise since the change in jobless claims is very small in relation to the total labor market. Supporting the noise argument is the chart below which shows non-seasonally adjusted jobless claims are still down year over year, which is a good thing.
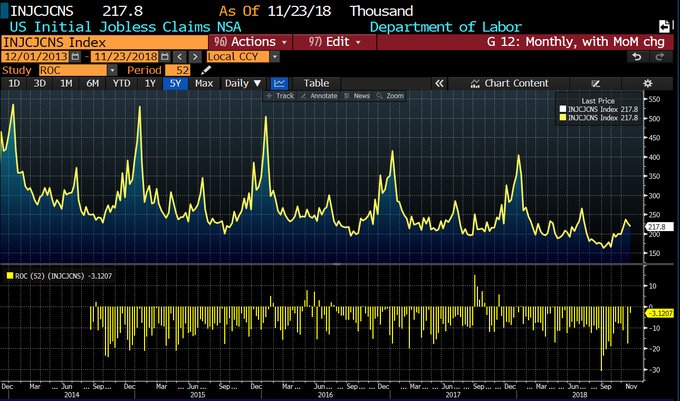
Source: Bloomberg
Both arguments are correct since these are small changes and might be noise, but jobless claims do increase during and prior to recessions. Even though these changes are small, jobless claims don’t give us much lead time in predicting stock market moves. By the time the weakness is fully confirmed, by the 4 week moving average of claims rising above 300,000, stocks will already be down. Bullish investors argue that claims have spiked before without any issues as you can see in the chart below. However, we feel each increase needs to be monitored.
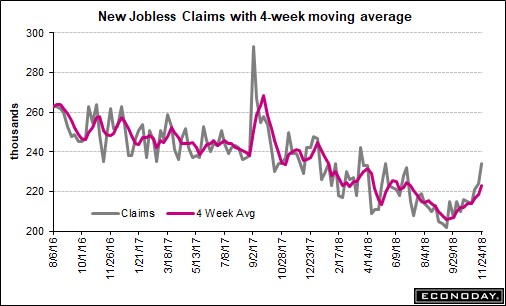
Source: Econoday
Sometimes spikes are noise and sometimes they aren’t. It’s up to investors to scope out changes in the labor market to separate the signals from the noise. It’s fair to pay closer attention to negative catalysts when overall economic growth is slowing within a global growth slowdown like we’re seeing now.
Initial claims for the week of November 24th were 234,000 which was an increase of 10,000 from the prior week. This is the 3rd straight week of increases. The 4 week moving average was up from 218,500 to 223,250. That’s the highest reading since July. Keep in mind, there aren’t any special one time factors which are pushing this report higher.
The claims are still incredibly low as the cycle trough had the lowest jobless claims in relation to the labor market in history. Jobless claims have gone from “spectacular” to “great” which is bad in rate of change terms. Continuing claims for the week earlier were up 50,000 and the 4 week moving average was up 20,000 to 1.668 million. The trough in October of 1.635 million was a 45 year low for continuing claims. The unemployment rate for insured workers increased 0.1% to 1.2%.
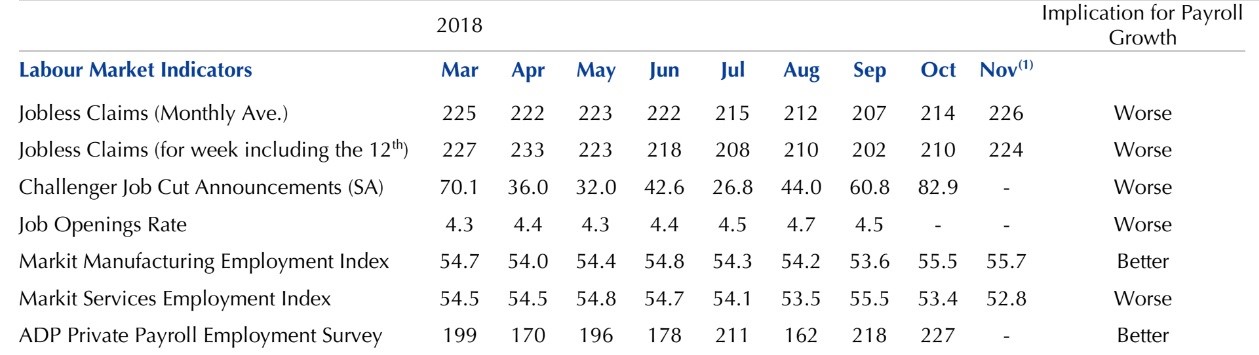
Source: Capital Economics
The table above summarizes the latest labor market readings. Most measurements imply payroll growth will be worse. The Markit and ADP reports signal growth will improve. When the unemployment rate starts increasing year over year, it has historically been a strong sell signal. When that’s combined with high valuations, it’s terrible for stocks. According to the Shiller PE, stocks are expensive. They have gotten much cheaper according to the trailing PE multiple because earnings have grown quickly while stocks haven’t had a great year.
Great Holiday Shopping Season
This holiday shopping season has been great and will likely be amazing when the complete results come in. It doesn’t seem logical to see great retail sales growth along with increasing jobless claims. However, remember that the jobless claims are still great. Plus, gas prices are falling which is bringing down overall inflation; nominal wage growth is accelerating as the labor market is getting tighter.
As we mentioned, the holiday shopping season has been great. As you can see from the chart below, the Redbook same store sales report showed 7.9% year over year growth in the week of November 24th which included Black Friday which is the most important shopping day of the year. This was the fastest growth rate in at least 12 years. Month to date growth of 6.7% is a high for the year.
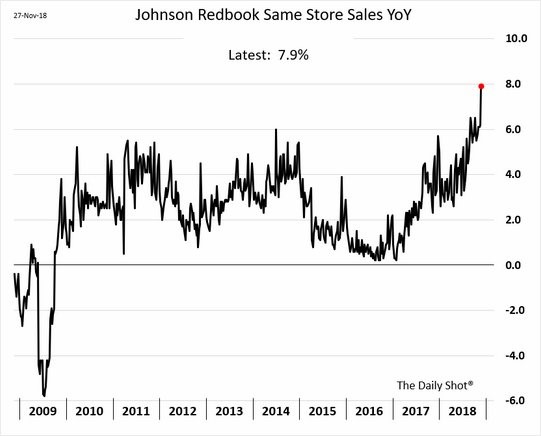
Source: The Daily Shot
The chart below shows the Evercore ISI retail sales survey confirms the great news from the Redbook metric.
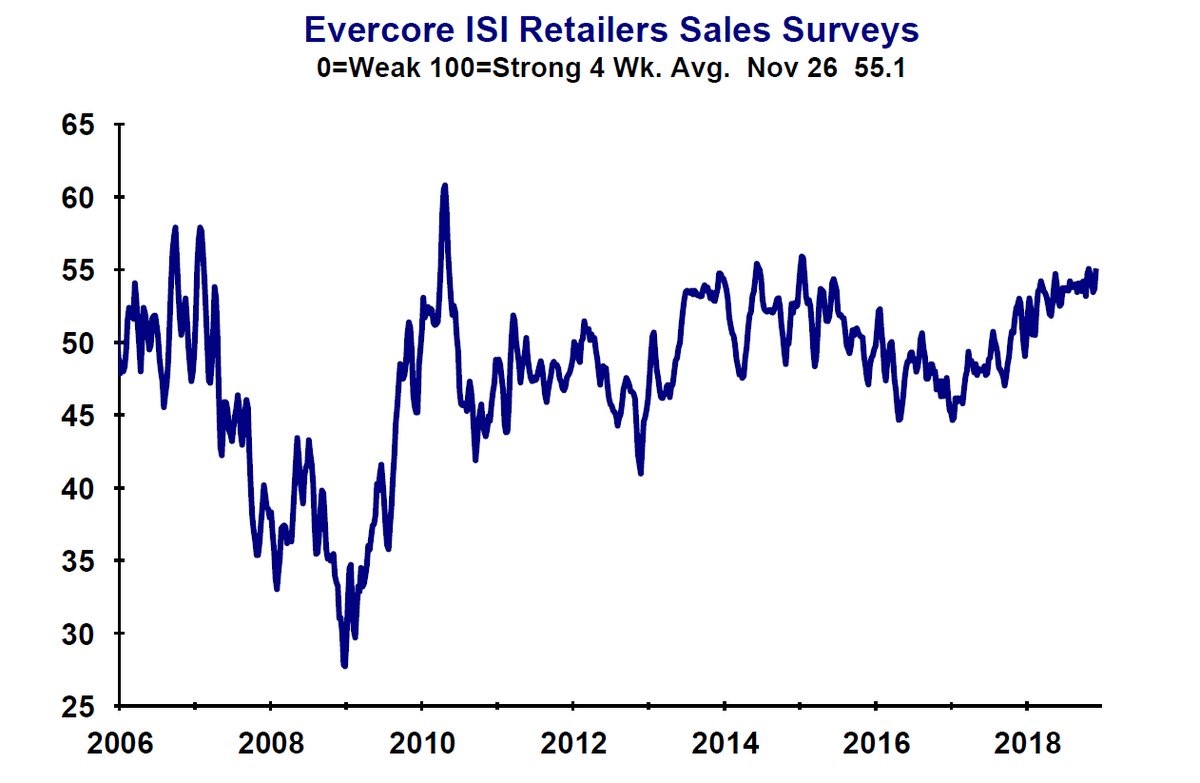
Source: Evercore
In 2018 Evercore ISI retail sales survey has consistently been near the cycle high. The 4 week average as of November 26th was 55.1. The Monday after Thanksgiving it was 58.2 which was way higher than the 53.2 reading in 2017 and the average reading of 49 from 2002 to 2017 on the Monday after Thanksgiving.
According to RetailNext, which uses cameras to measure store traffic in malls and stand-alone retailers, traffic on Thanksgiving and Black Friday fell 5% to 9%. According to ShopperTrak, growth fell only 1% year over year. These don’t seem like remarkable numbers because consumers are shifting their spending online. According to Adobe Systems, internet sales from Wednesday to Black Friday increased 26.4% to $12.3 billion.
Unique Cycle
This expansion has reached unprecedented levels even before it becomes the longest one since the 1800s in June 2019. As you can see from the chart below, the economy is in the longest stretch where nominal GDP growth is above the Fed funds rate.
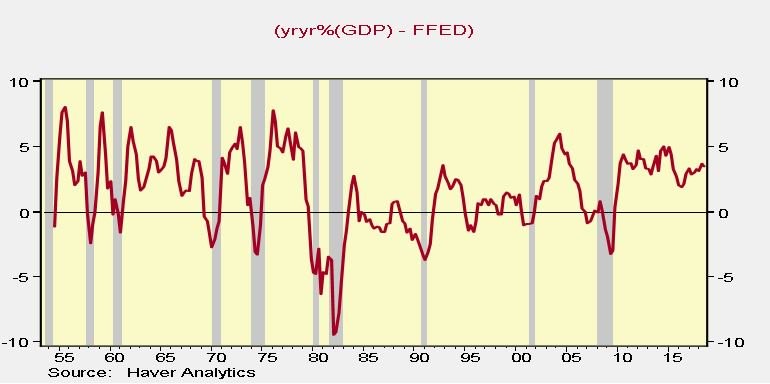
Source: Haver Analytics
The length has been long because the Fed has been dovish. Even with the Fed starting to hike rates quicker in 2018, the difference isn’t close to zero. The Fed has been much more dovish than the 1990s which is the only cycle longer than this one since the 1800s.
Forecasting Returns
The chart below uses the data from the Haver Analytics chart above to forecast real S&P 500 5 year annualized returns.
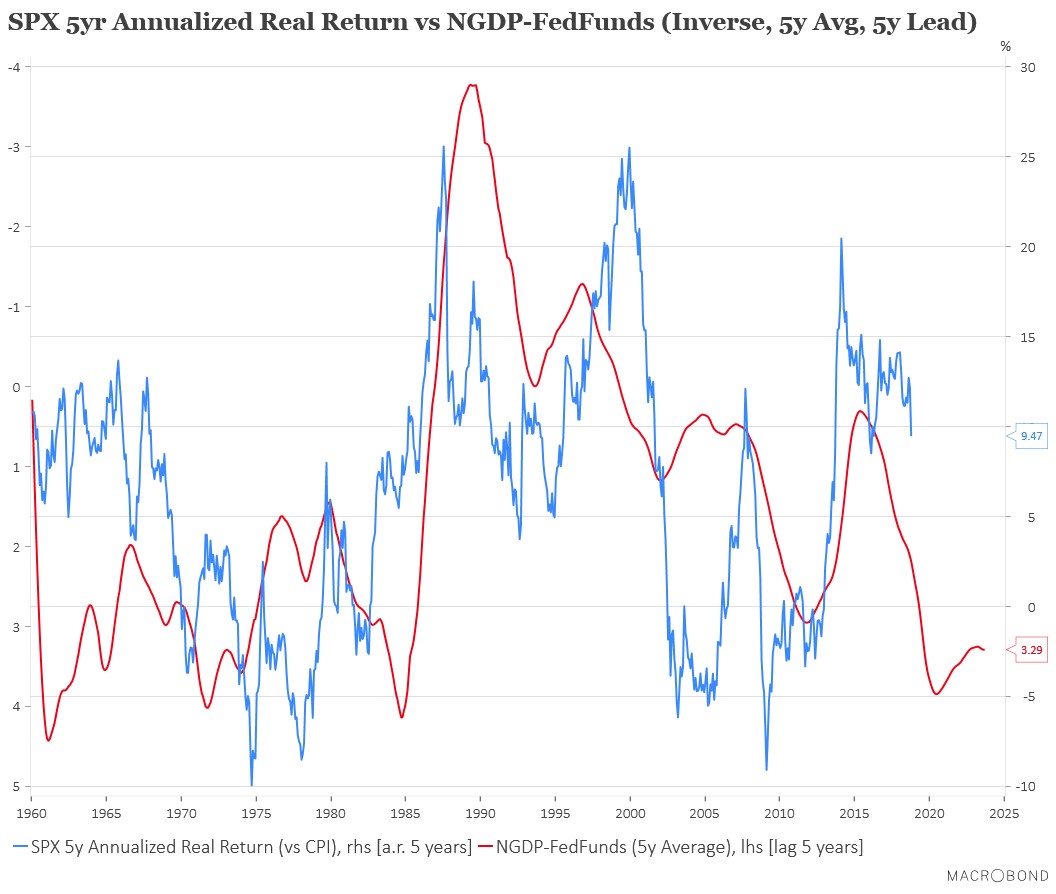
Source: Macrobond
The nominal growth rate being much higher than the Fed funds rate is bad for real returns possibly because it signals the cycle is near its peak and that the Fed will be raising rates to catch up to the economy. Keep in mind, nominal GDP minus the Fed funds rate is inverted to show the correlation. The metric has a 5 year lead, indicating it expects negative 5 year annualized real returns for the S&P 500 in the next 5 years.
Conclusion
Jobless claims have been increasing for the past 3 weeks which may be an early warning sign of a recession or just noise. Investors should be concerned if this metric continues to increase. The Black Friday holiday shopping season was great. Online sales growth was amazing. Nominal GDP growth being high above the Fed funds rate is far from a Goldilocks scenario. It signals very weak 5 year annualized returns are coming in the next 5 years.
Disclaimer: Please familiarize yourself with our full disclaimer here.


