
Looking Behind The CPI Headlines To Spot Inflation Trends
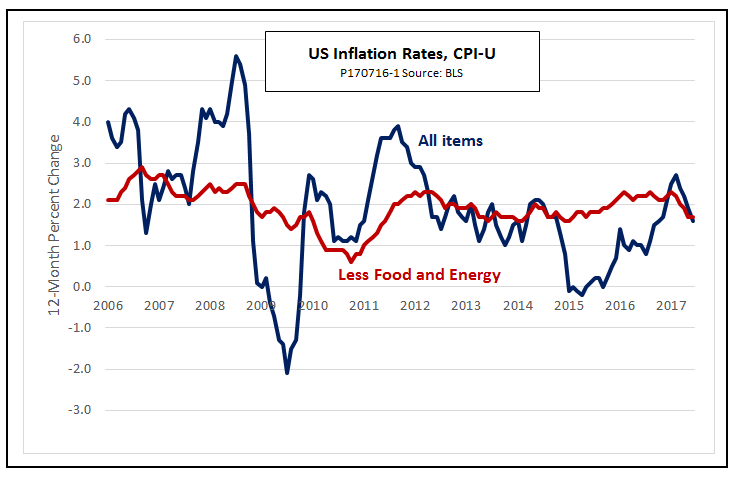
On Friday, the Bureau of Labor Statistics (BLS) announced that US consumer price index increased by 1.6 percent from June 2016 to June 2017. The core inflation rate, which excludes food and energy, reached a 2-year low of 1.7 percent. What does this mean for the economy, looking forward?
The CPI-U and the core CPI are the inflation rates that most frequently make the headlines, but people who watch inflation closely look at other numbers, too. Another important number is the personal consumption expenditure index (PCE), derived from the national income accounts that are used to calculate GDP. The PCE is the inflation indicator most closely watched by the Federal Reserve in setting interest rates. The Fed considers PCE inflation of about 2 percent to be consistent with its target for price stability.
The PCE, however, is not available as quickly as the CPI. The data that underlie it come from the Bureau of Economic Analysis (BEA), which publishes complete national income data only on a quarterly basis, subject to revisions. For example, GDP for the third quarter of this year, July through September 2017, will not be available in preliminary form until late October, and even then will be subject to revisions in November and December.
Market watchers would love to have a crystal ball—a way to look ahead to estimate how the PCE will behave over the coming months. The core CPI, shown in the above chart, is a step in that direction, since it omits the influence of volatile food and energy prices, but there is an even better one: The median CPI, published monthly by the Cleveland Fed.
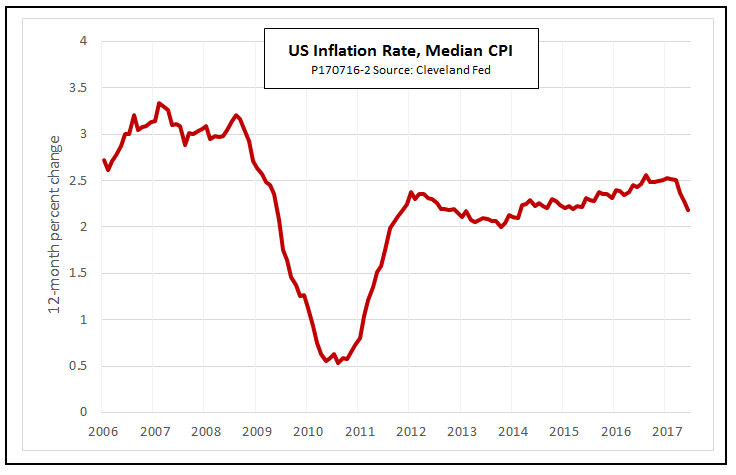
The median CPI is calculated by listing the rates of inflation for each separate item in the CPI—gasoline, tomatoes, apartment rents and so on—in descending order, and then picking the one right in the middle. Half the prices rise faster than the median, and half less rapidly. An explainer video provided by the Cleveland Fed explains that using the CPI to measure inflation is like estimating the course of a swarm of bees by watching the bee closest to the center of the swarm. Doing that avoids being distracted by any bees that happen to be flying faster or slower than the swarm, or maybe in some completely different direction.
Does it work? Economists at the Cleveland Fed have concluded that the median CPI is twice as good at forecasting the future trend of the PCE as the core CPI from the BLS.
If you compare the two charts, you will see that inflation as measured by both the core CPI and the median CPI has dipped in the last couple of months. The median measure is running a little above the Fed’s 2-percent target, whereas the core CPI is a little below 2 percent. The median CPI, then, hints at a slightly higher likelihood of more rate increases from the Fed later this year.


Do you think that the Fed would risk spooking the markets with a rate increase? With the amount of uncertainty going on right now it seems pretty risky!
As of right now, I would bet yes, but there is time for data to change before next expected increase (toward the end of the year).
What do you think caused the recent dip in Median CPI? It seems very sudden
Good analysis, I concur.
Good read, I've added you to my follow list.