Is Trump Really Special? Economic Policy Uncertainty Edition
Despite reader Ed Hanson‘s comment:
[T]he current Monthly EPU is at an elevated level, but it has been at this elevated level 7 out of the past 9 years. The elevated value is better described as normal for about the last decade.
And his concluding admonishment:
Perspective, Menzie
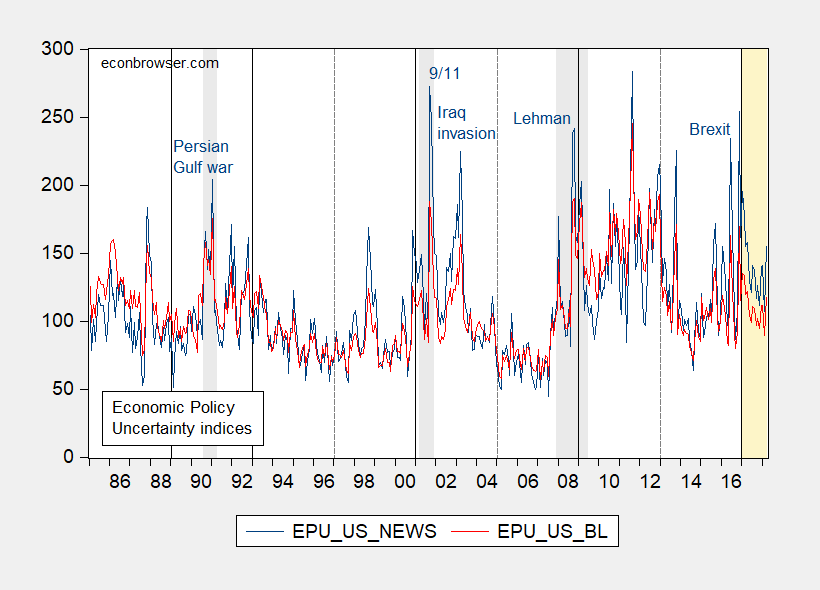
I still believe that economic policy uncertainty as measured by the news based index (which Ed Hanson was discussing) is elevated.
(Click on image to enlarge)

Figure 1: Monthly Economic Policy Uncertainty, news based (blue), baseline (red), as reported. Source: http://www.policyuncertainty.com.
The March reading for the news based series (baseline series) of 155.4 (117.7) exceeds the sample mean of 110.5 (107.9). The news based series exceeds the 2008M04 2018M03 sample mean of 135.9, while the baseline series falls below the 130.2 mean.
What does a formal analysis convey? The results depend on which index is used. I rely on the news-based series, since this is the focus of Baker, Bloom and Davis’s more recent work (Quarterly Journal of Economics, 2016). This series is also the series displayed on the policyuncertainty.comfrontpage.
Running OLS regression over the 1985M01-2018M03 period yields the following results.
EPU = 94.61 + 9.21ELEC_TRANS – 5.80GWHBUSH -14.56CLINTON – 8.40GWBUSH + 25.22OBAMA + 38.21TRUMP + 6.80DIVIDEDGOV + +41.64PERSIANGULFWAR + 117.339/11 + 77.54IRAQINV + 40.60LEHMAN + 63.38BREXIT + 11.31RECESSION
Adj.-R2 = 0.40, SER = 31.26, DW = 0.97, N=399. bold denotes significance at the 10% MSL, using HAC robust standard errors.
Where ELEC_TRANS is a dummy variable that takes on a value of 1 for the 12 months before an election through 12 months after inauguration, except when the president is re-elected, in which case the dummy takes on a value of 1 in the 12 months before to up to the month of the election; GWHBUSH, CLINTON, OBAMA, and TRUMP are dummy variables the respective administrations; DIVIDEDGOV is a dummy variable for when the two houses and the executive branch are not all controlled by the same party, RECESSION is a dummy variable for NBER defined recession dates; LEHMAN is a dummy variable taking a value of 1 for 2008M09-2009M06, 9/11 for 2001M09-M11, BREXIT for 2016M06-M07. Note the exclusion of a Reagan administration dummy means the constant pertains to that presidency.
Since the distribution of the EPU variable seemed highly non-Normal (as did that of the residuals from the above regression, see histogram in this post), I used robust regression (essentially predicting median values instead of mean). This yielded:
EPU = 99.86 + 7.55ELEC_TRANS – 5.22GWHBUSH -16.14CLINTON -15.38GWBUSH + 15.69OBAMA + 32.83TRUMP – 0.08DIVIDEDGOV + +32.96PERSIANGULFWAR + 136.279/11 + 79.77IRAQINV + 26.15LEHMAN + 76.20BREXIT + 18.41RECESSION
Adj.-R2 = 0.26, SER = 32.00, N=399. bold denotes significance at the 10% MSL.
The baseline index, which incorporated uncertainty regarding the expiration of tax code provisions, and forecaster disagreement, yields different results than the news-based series (which is comparable across countries). With weight on forecaster disagreement (sure to be high during the great recession) and uncertainty regarding tax code provisions (due to the stimulus package and conflict between the executive and legislative branches during the Obama-Boehner years), the Obama and Trump coefficients re-arrange so that Trump era uncertainty looks less elevated. The baseline index results are sensitive to the inclusion of time trend. (They are also sensitive to inclusion of a quantitative easing dummy variable, which takes on a value of 1 from 2008M11-2014M10; then TRUMP and OBAMA take on similar coefficients).
The data are here. The output is here.
I conclude that Trump is indeed really special, when it comes to policy uncertainty.
Disclosure: None.


