
Illustration Of Falling Economic Growth In Developed Countries
In this post, we continue analysis of GDP per capita in developed countries and BRIC. It was shown in two previous posts that the evolution of real GDP per capita is rather linear (not exponential) since 1960 and in many cases the growth rate is much lower than its linear potential (so called inertial growth). Extended analysis was presented in our papers and we would like here just to stress the fact that many developed countries demonstrate poor performance.


Fig. 1. Austria: annual increment of real GDP per capita (upper panel) and the corresponding rate of growth (lower). On average, the annual increment between 1960 and 2015 is $340. The growth rate has clear negative trend from 1960 to 2015. The current growth rate fluctuates around 1.5% per year.

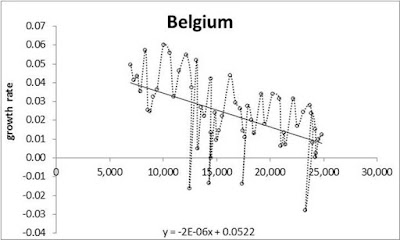
Fig. 2. Same as in Fig. 1 for Belgium. On average, the annual increment between 1960 and 2015 is $326
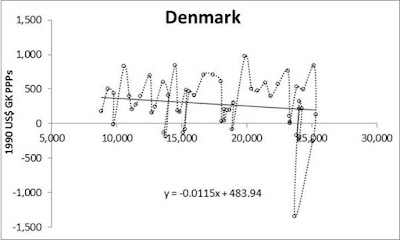

Fig. 2. Same as in Fig. 1 for Denmark. On average, the annual increment between 1960 and 2015 is $282.
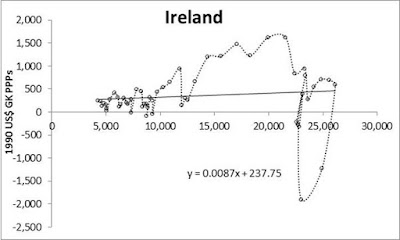

Fig. 4. Same as in Fig. 1 for Ireland. On average, the annual increment between 1960 and 2015 is $357. There was a period of extremely high growth rate, which ended with a tremendous fall completely compensating the years of growth.
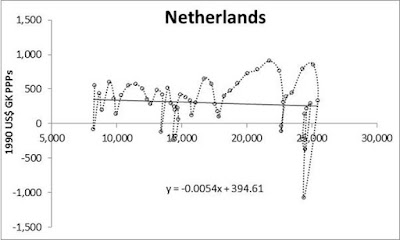

Fig. 5. Same as in Fig. 1 for Netherlands. On average, the annual increment between 1960 and 2015 is $304

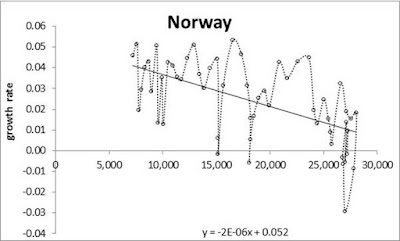
Fig. 6. Same as in Fig. 1 for Norway. On average, the annual increment between 1960 and 2015 is $363


Fig. 7. Same as in Fig. 1 for Portugal. On average, the annual increment between 1960 and 2015 is $191
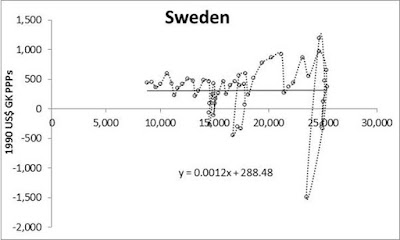
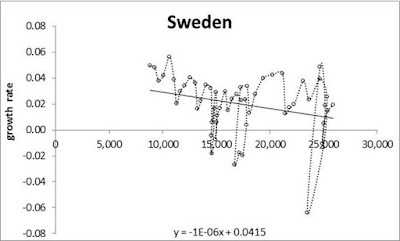
Fig. 8. Same as in Fig. 1 for Sweden. On average, the annual increment between 1960 and 2015 is $313

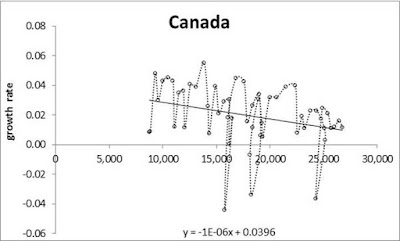
Fig. 9. Same as in Fig. 1 for Canada. On average, the annual increment between 1960 and 2015 is $323
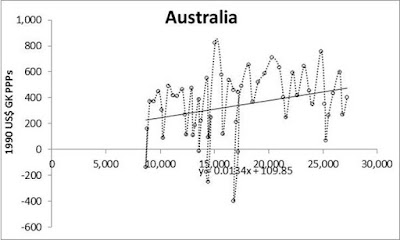
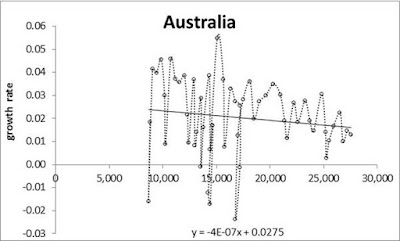
Fig. 10. Same as in Fig. 1 for Australia. On average, the annual increment between 1960 and 2015 is $338


Fig. 11. Same as in Fig. 1 for New Zealand. On average, the annual increment between 1960 and 2015 is $203


Fig. 12. Same as in Fig. 1 for Japan. On average, the annual increment between 1960 and 2015 is $345
Disclosure: None


