
Farm PPI And Prospects For The Farm Sector
The PPI for farm products was released yesterday.
(Click on image to enlarge)
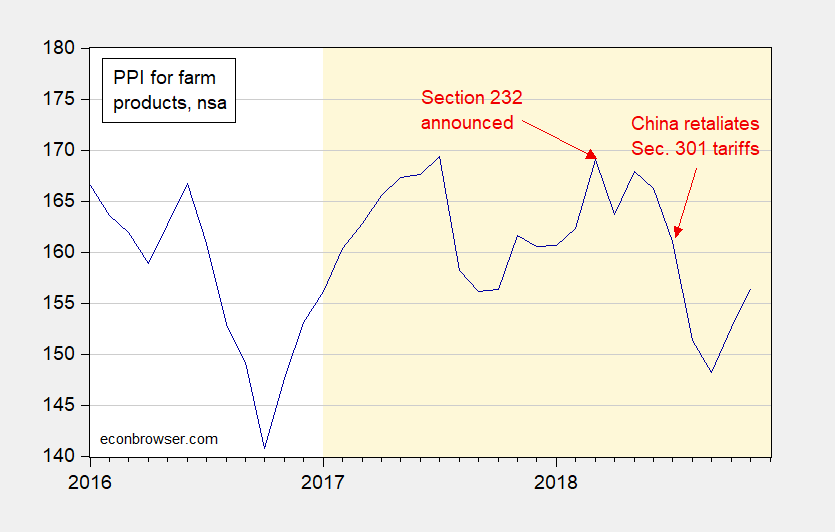
Figure 1: PPI for farm products, 1982=100. Light orange shading denotes Trump Administration. Source: BLS.
Farm commodity prices have been depressed by trade retaliation spurred by US tariffs imposed under Section 232 and Section 301, as well as the strong dollar associated with expansionary fiscal policy.
Farm net value-added follows the PPI for farm products. Using an error correction model over the 2005Q1-2018Q2 period, I forecast 2018Q4 farm value-added will drop by about 5% (log terms).
(Click on image to enlarge)
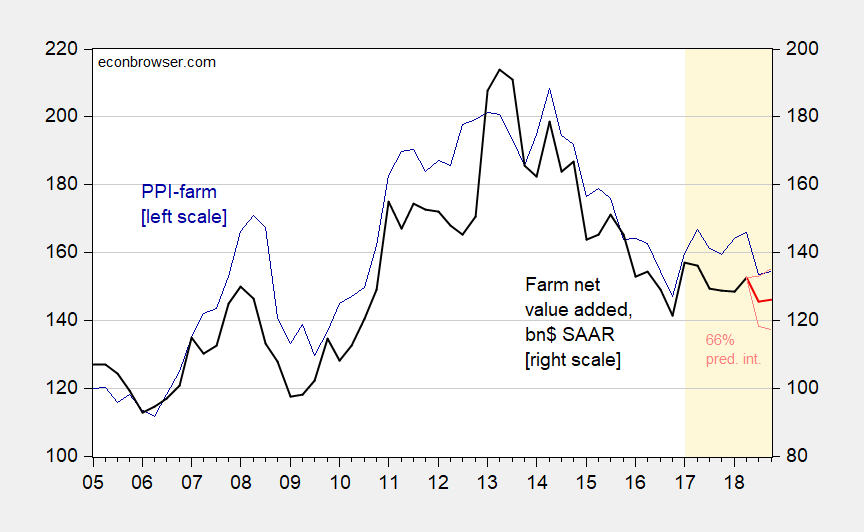
Figure 2: PPI for farm products (blue, left scale); farm net value added in billions of dollars, SAAR (black, right scale), and forecast from error correction model imposing unitary long run elasticity (red, right scale), plus/minus one standard error (pink lines). 2018Q4 PPI observation for October-November. Light orange shading is Trump Administration. Source: BEA, BLS, and author’s calculations.
Disclosure: None.


