
Empire State Manufacturing Survey: Activity Continues To Grow In September
This morning we got the latest Empire State Manufacturing Survey. The diffusion index for General Business Conditions at 19.0 was a decrease of 6.6 from the previous month's 25.6.
The Investing.com forecast was for a reading of 23.2.
The Empire State Manufacturing Index rates the relative level of general business conditions in New York state. A level above 0.0 indicates improving conditions, below indicates worsening conditions. The reading is compiled from a survey of about 200 manufacturers in New York state.
Here is the opening paragraph from the report.
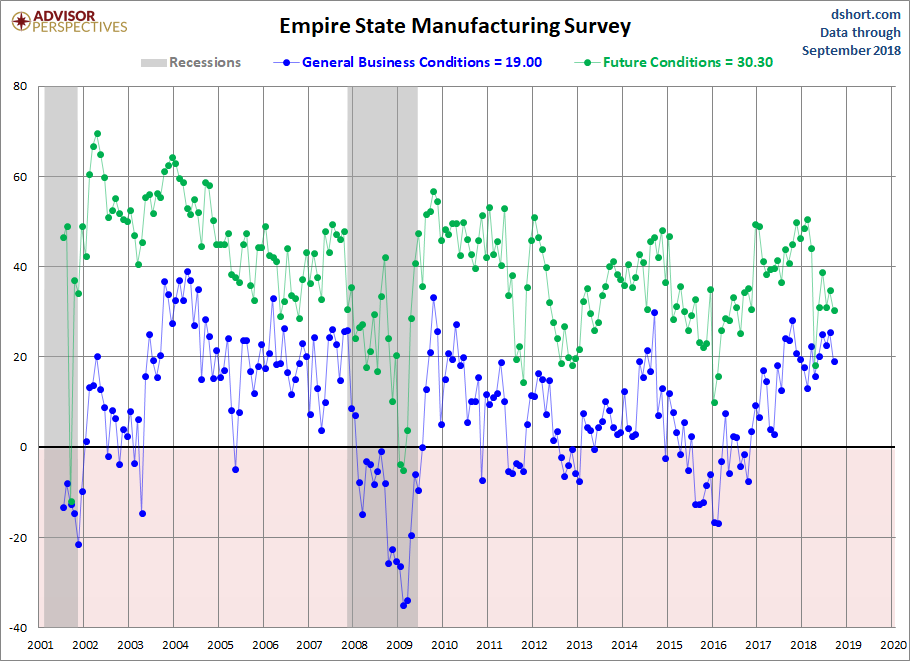
Business activity continued to grow at a solid clip in New York State, according to firms responding to the September 2018 Empire State Manufacturing Survey. The headline general business conditions index showed ongoing trength, but moved down seven points to 19.0, pointing to a slower pace of growth than last month. New orders and shipments grew moderately. Delivery times continued to lengthen, and inventories moved higher. Labor market indicators pointed to an increase in employment levels and longer workweeks. Price indexes were little changed and remained elevated, suggesting ongoing significant increases in both input prices and selling prices. Looking ahead, firms remained fairly optimistic about the six-month outlook. [source]
Here is a chart of the current conditions and its 3-month moving average, which helps clarify the trend for this extremely volatile indicator:
(Click on image to enlarge)

Click this link to access a PDF set of charts of the individual components over the past 12 months.
Since this survey only goes back to July of 2001, we only have one complete business cycle with which to evaluate its usefulness as an indicator for the broader economy. Following the Great Recession, the index has slipped into contraction multiple times, as the general trend slowed. 2015 saw a gradual decline that began picking up in 2016.
Here is an overlay of the current and future conditions (a six-month outlook).
(Click on image to enlarge)
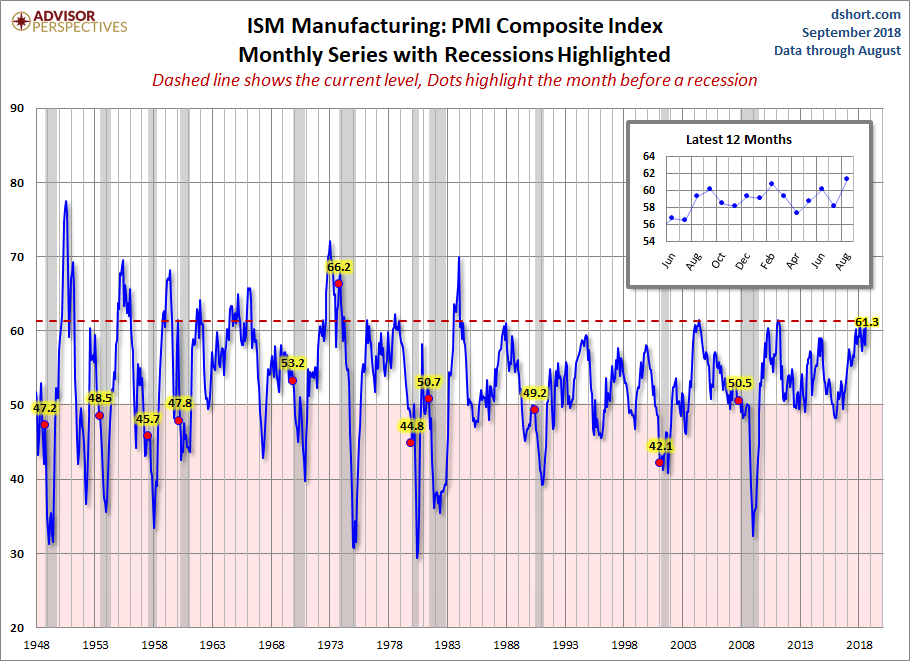
Meanwhile, here's another look at the latest ISM Manufacturing Business Activity Index.
(Click on image to enlarge)
Let's compare all five Regional Manufacturing indicators. Here is a three-month moving average overlay of each since 2001 (for those with data).
(Click on image to enlarge)
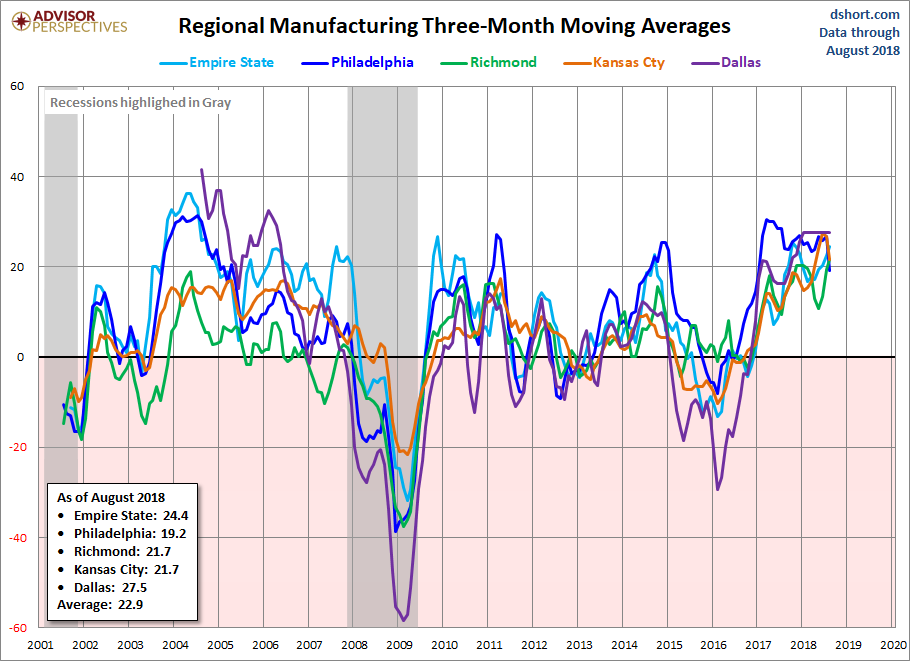
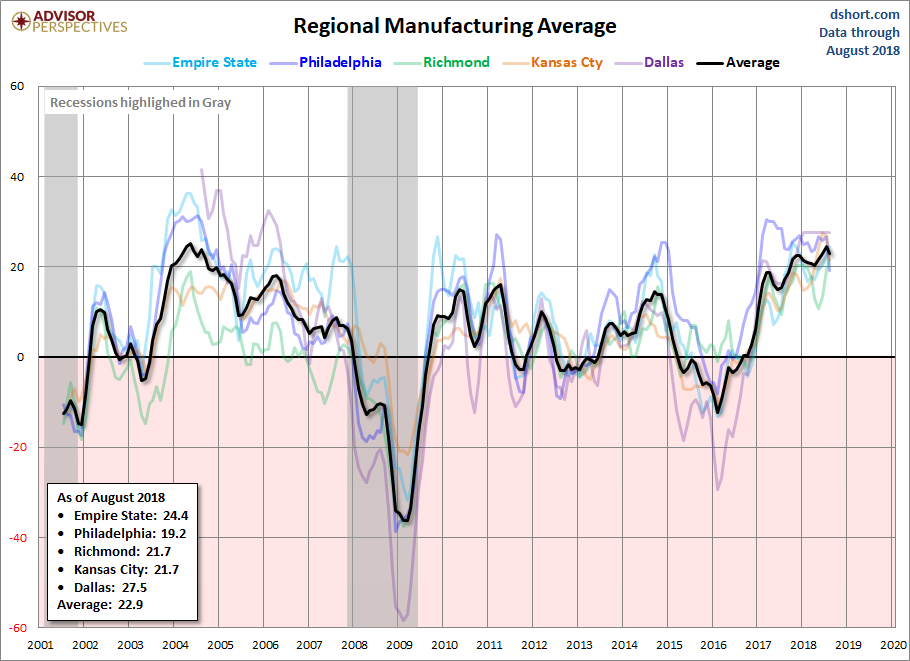
Here is the same chart including the average of the five. Readers will notice the range in expansion and contraction between all regions.
(Click on image to enlarge)
Let's keep a close eye on some of the regional manufacturing indicators in the months ahead.


