
Debt, Deficits & Economic Warnings
While the world has been focused on the Federal Reserve, the markets, and the upcoming election, few have noticed the expansion of the deficit in recent months which is now in excess of $667 billion up from a recent low of $530 billion. The chart below shows the history of U.S. surplus/deficit:
(Click on image to enlarge)
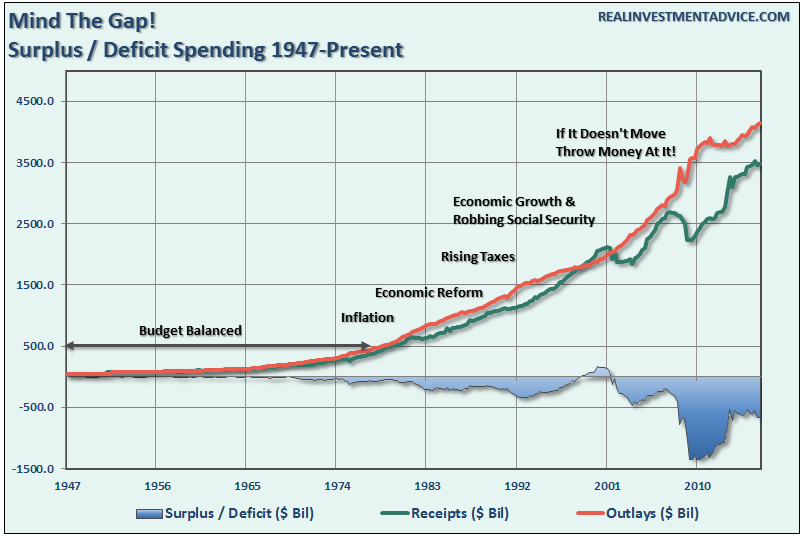
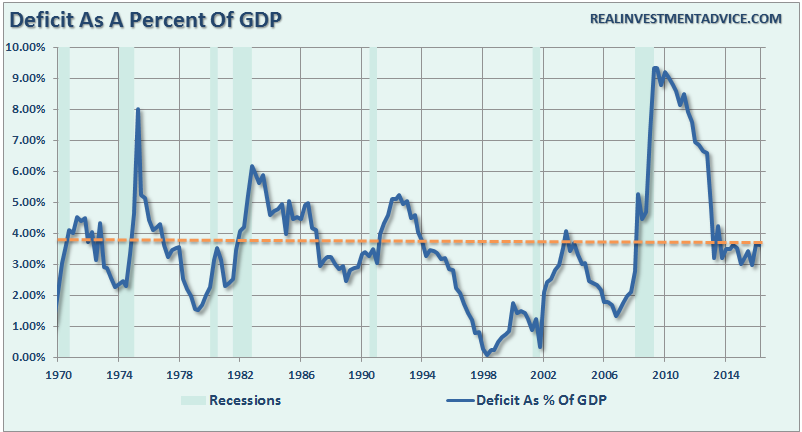
During the financial crisis, the deficit ballooned to a record of $1.35 trillion as tax revenue declined as Government spending swelled. Importantly, the Federal Deficit was approaching 10% in 2009, a historical record for the U.S., but still remains at levels associated with weaker economic growth rates and recessions.
(Click on image to enlarge)
The decline in the deficit was artificial in many ways as it was primarily due to the reforms from the “2011 Budget Control Act” which including tough spending cuts and a big tax bite that impacted a large majority of the middle class.Much of that “austerity” has now been reversed.
Tax The Rich
The surge in tax revenues was a direct result of the “fiscal cliff” at the end of 2012 as companies rushed to pay out special dividends and bonuses ahead of what was perceived to a fiscal disaster and higher tax rates. The large surge in incomes was primarily generated at the upper end of the income brackets where individuals were impacted by higher tax rates. Those taxes were then paid in April and October of 2013 and accounted for the sharp decline in the deficit. Also, it is important to remember that payroll taxes also increased due to the expiration of the payroll tax cut from 2010. (Note: the increased tax collection from payrolls remains currently.)
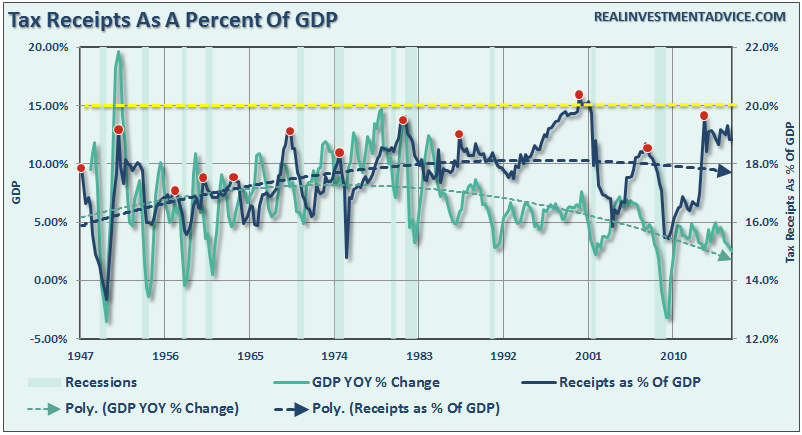
This surge in tax revenue can be seen more clearly in the chart below of tax receipts as a percentage of GDP.
(Click on image to enlarge)
While making the rich “pay their fair share” may increase revenue in the short run, over the longer term higher tax rates, and the subsequent redistribution of wealth leads to lower economic growth. Louis Woodhill put it best:
“To ‘tax’ is to take away something from someone and give it to the government. ‘The rich’ are rich because they own a lot of assets. So, what it means to ‘tax the rich’ is to take assets away from rich people and transfer them to the government.
So, what are the assets that the rich own? The rich don’t have money bins full of cash, like Scrooge McDuck. Rather, they own things like factories, office buildings, and oil wells, either directly or indirectly via stocks and bonds. In other words, the rich own most of the ‘nonresidential fixed assets’ of the nation. These assets certainly count as ‘wealth’, but what they are physically are the tools that workers use to produce America’s GDP.”
This is critically important to understand. By increasing taxes, to generate additional revenue for the government, you decrease the available capital that could be used for productive investments. Since the government doesn’t want factories, office buildings, or oil wells, but rather cash, this forces the liquidation of productive investments thereby reducing capacity for economic growth.
The current Administration is failing once again to recognize the problems that exist with this country, at this moment, does not lie with the “rich.” Instead, the problem is a lack of ability for consumers to maintain a standard of living that is well beyond their earnings capability. While the two most recent Administrations have been heavily criticized for running burgeoning deficits – the reality is that the average American has been doing the same for the past thirty years.
(Click on image to enlarge)

While tax dollars do get recycled back into the economy, repeated studies have shown that government spending has a much lower “multiplier” effect as compared to dollars spent directly by consumers and businesses.
I have highlighted the periods when receipts as a percentage of GDP have peaked. There are two things worth noting in the chart above/below. Rising levels of receipts have coincided with stronger levels of economic growth in the early stages which is not surprising as more revenues lead to higher collections. However, once those collections exceed 18% of GDP, it has generally marked the peak of economic activity and a subsequent recessionary drag in the economy.
There is one other point to be made. While there are many calls to raise taxes on the rich, give more to the poor, what the chart shows is that none of that really makes much difference. Regardless of the level of tax rates – tax receipts as a percentage of the economy has remained mired between 16 and 21%. Why? Because when you raise taxes, you lower economic growth and, therefore, collect less in revenue. During recessions, tax collections are at the lower end of the range while during expansions collections are at their highest.
So, what does all of this mean? As Arthur Laffer noted 3 decades ago, it really is possible to set tax rates too high such that it actually hurts the economy.
We appear to once again be in such a condition now.
The chart below shows receipts as a percent of GDP as compared to the S&P 500 index. (Note: Each peak in tax collections has coincided with a mean-reverting event in the markets as a recessionary drag took hold.)
(Click on image to enlarge)
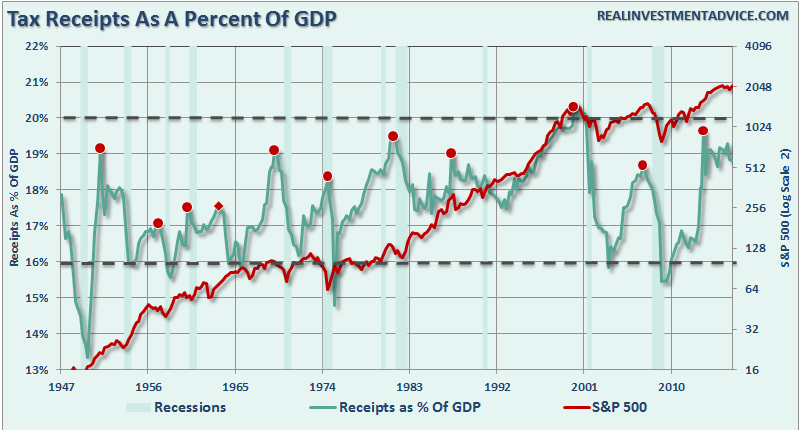
While there are many that expect that the markets can repeat the secular bull market of the 90’s, and by extension, receipts could test the previous high, this is not likely. The demographic and economic makeup, valuation levels and interest rates currently weigh heavily against that probability.
It’s The Deficit Stupid
As stated above, as the “rich” invest in productive investments it leads to higher employment, strong consumer demand and economic growth. In turn, this leads to higher tax revenue.
However, deficits, and deficit spending, are HIGHLY destructive to economic growth as it directly impacts gross receipts and saved capital equally. Like cancer – running deficits, along with continued deficit spending, continues to destroy saved capital and damages capital formation.
Debt is, by its very nature, a cancer on economic growth. As debt levels rise it consumes more capital by diverting it from productive investments into debt service. As debt levels spread through the system it consumes greater amounts of capital until it eventually kills the host. The chart below shows the rise of federal debt and its impact on economic growth.
(Click on image to enlarge)
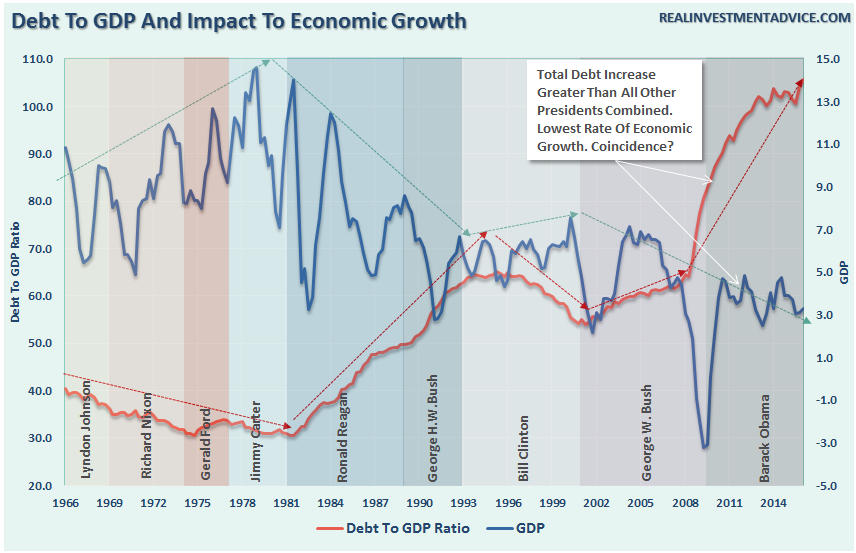
The reality is that the majority of the aggregate growth in the economy since 1980 has been financed by deficit spending, credit creation and a reduction in savings. This reduced productive investment in the economy and the output of the economy slowed. As the economy slowed, and wages fell, the consumer was forced to take on more leverage to maintain their standard of living which in turn decreased savings. As a result of the increased leverage more of their income was needed to service the debt – and with that the “debt cancer” engulfed the system.
The Austrian business cycle theory attempts to explain business cycles through a set of ideas. The theory views business cycles:
“As the inevitable consequence of excessive growth in bank credit, exacerbated by inherently damaging and ineffective central bank policies, which cause interest rates to remain too low for too long, resulting in excessive credit creation, speculative economic bubbles and lowered savings.”
(Click on image to enlarge)
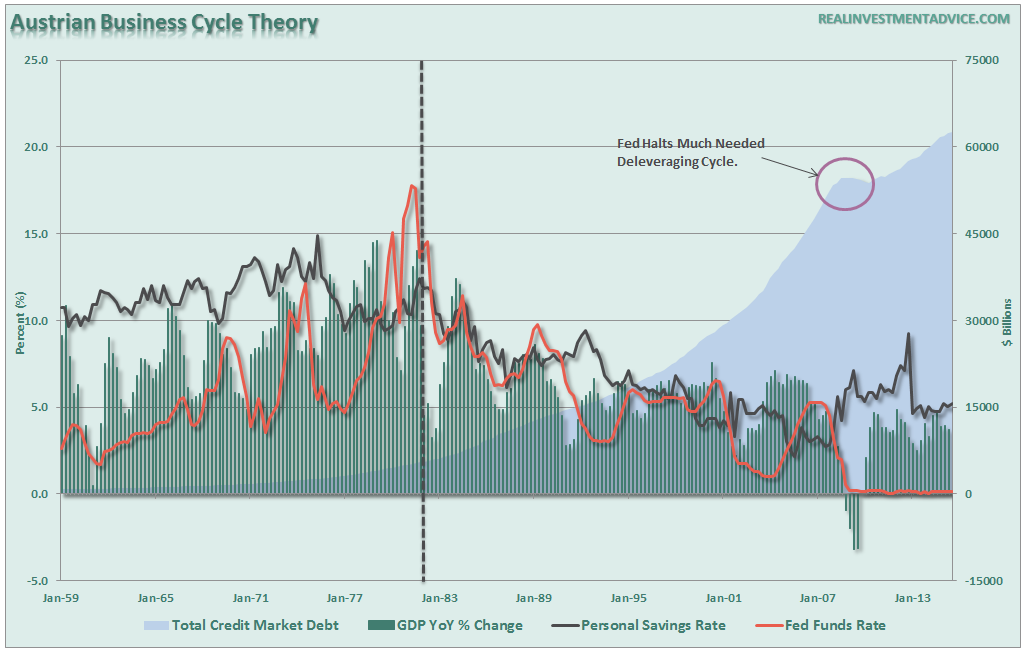
The problem that is yet not recognized by the current Administration and mainstream economists is that the excessive deficits and exponential credit creation can no longer be sustained. The process of a “credit contraction” will eventually occur over a long period of time as consumers and governments are ultimately forced to deal with the deficits.
The good news is the process of “clearing” the market will eventually allow resources to be reallocated back towards more efficient uses and the economy will begin to grow again at more sustainable and organic rates.
Today, however, expectations of a return to economic growth rates of the past are most likely just a fairy tale. The past 8-years of stock market returns have been fueled by trillions of dollars of support and direct injections into the financial system – that support is not sustainable in the long run. While the injections have kept the economy from falling into a depression in the short term – the unwinding of that support will suppress economic growth for many years to come.
There is no way to achieve the necessary goals “pain-free.” The time to implement austerity measures is when the economy is running a budget surplus and is close to full employment. That time was two Administrations ago when the economy would have slowed but could have absorbed and adjusted to the restrictive measures. However, when things are good, no one wants to “fix what isn’t broken”. The problem today is that with a high dependency on government support, high levels of underemployment and rising budget deficits, the implementation of austerity measures will only deter future economic growth, which is dependent on the very things that need to be “fixed”.
The processes that fueled the economic growth over the last 30 years are now beginning to run in reverse, and when combined with the demographic shifts in the U.S., the impact could be far more immediate and prolonged than the media, economists and analysts are currently expecting. Sacrifices will have to be made, the economy will drag on at subpar rates of growth, individuals will be working far longer into their retirement years and the next generation of Americans will lead a far different life that what the currently retiring generation enjoyed.
It is simply a function of the math.
Disclosure: The information contained in this article should not be construed as financial or investment advice on any subject matter. Streettalk Advisors, LLC expressly disclaims all liability in ...
more

