
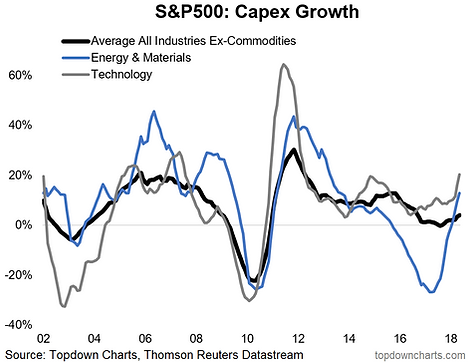
Chart: S&P 500 Capex Growth
Here's a chart I find really interesting, showing the annual pace of capex growth across some of the key industries/sectors of the S&P 500.The bottom line is that US business investment appears to be undergoing a revival.
The upturn in US corporate capital expenditure growth stands in contrast to the more stagnant pace of government investment, but that could change later in the year as the Trump infrastructure spending proposals come back on the agenda after the mid-term elections. Could be premature to call it, but a public/private investment boom would make the macro backdrop look really interesting.
For more and deeper insights on the global markets, good charts, and actionable investment ideas you may want to more


