
2017 Export To China Dependence, By State
Using Census and BEA data, one can assess at least in first order terms, what states will be impacted by tariffs against US exports — as well as the CNY depreciation that has occurred in the last few months.
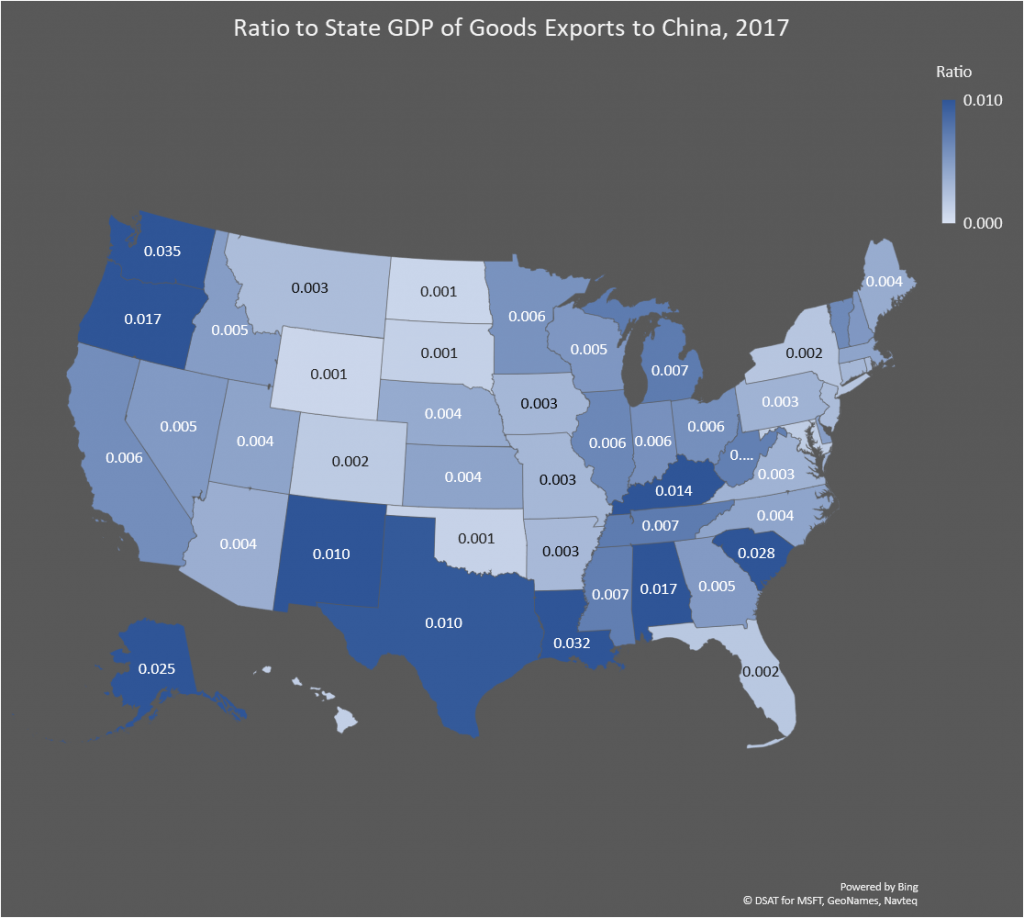
Figure 1: Ratio of goods exports to China to GDP, 2017. Source: Census via ITA, BEA, and author’s calculations.
The distribution of ratios is highly non-Normal. A few states are very highly dependent on exports of goods to China.
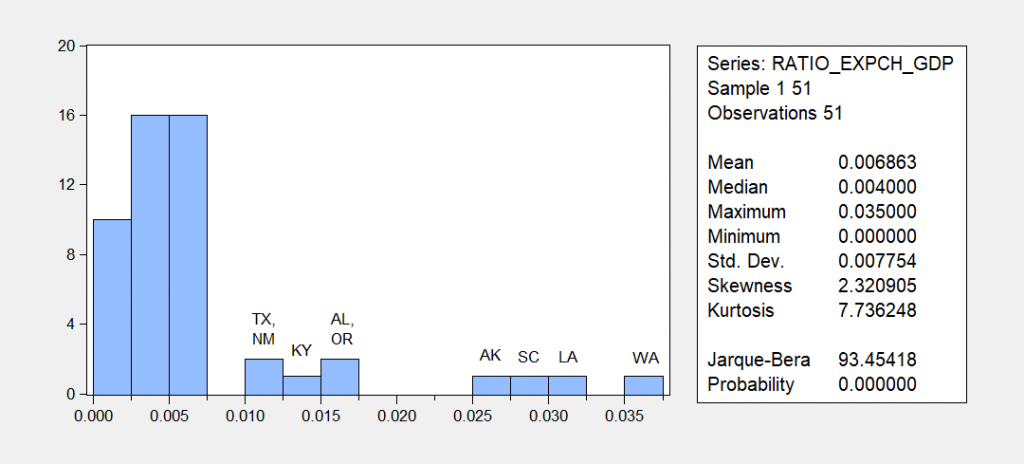
Figure 2: Histogram of ratios.
It is interesting that the intensity of dependence matches up with the China-agricultural export intensity in some cases (WA) and not in other cases; of course the divisor is different — here the numbers are normalized by state GDP. Illinois doesn’t show up prominently, for instance, which given soybeans, is kind of unexpected. But recall, the US also exports commercial aircraft to China (or used to…we’ll see going forward), thereby explaining WA and SC.
In any case, we are embarked on a great experiment. Mr. Trump has assured us “Tariffs are working big time.”, and we will see if that is indeed the case.
Disclosure: None.


