
Charts Show Federal Budget Still Within The Range Of "Salvation"
Written by Scott Grannis
The deterioration of the federal budget began in slow fashion over a year ago, and it's now become obvious. The deficit is still quite manageable but spending is firming while revenues are stagnating. The public sector is growing while the private sector struggles. Here are some updated charts that speak for themselves.
Since 1990, federal government spending has increased 230%, more than tripling in size. Revenues have increased by almost the same amount (228%).
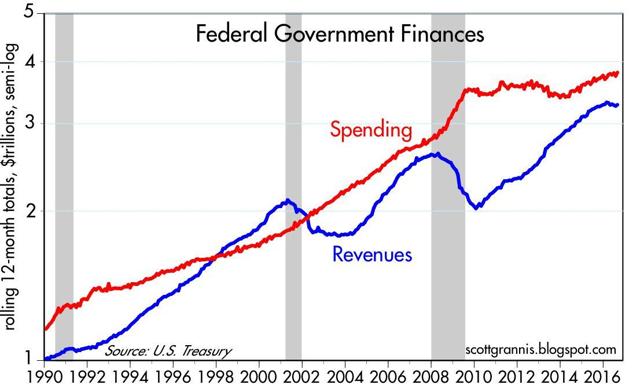
It's a testament to the amazing growth of the economy that federal spending and revenues over the decades have grown by about the same pace as the economy (i.e., both the lines in the chart below show a relatively flat trend).
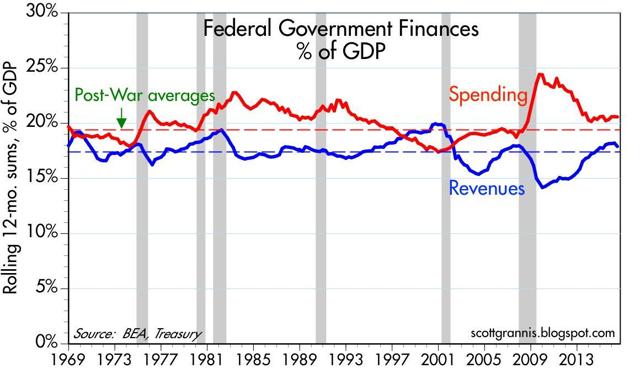
The current budget deficit, relative to the economy, is very much in line with what it has averaged over the postwar period.
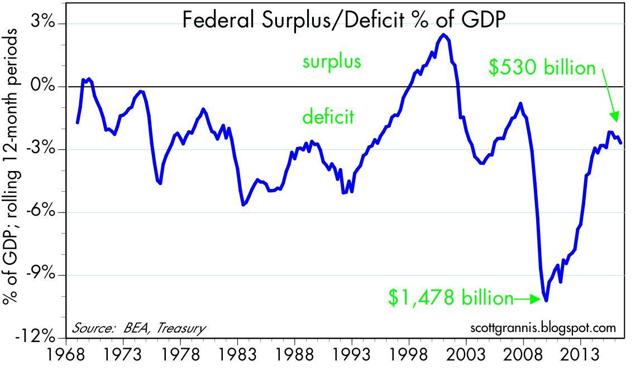
Revenues from estate and gift taxes are not included in the chart below, since they totaled a paltry $21.4 billion in the last 12 months, and represented only 0.6% of total federal revenues for the period. This is the equivalent of a rounding error for the federal government, yet it sustains an army of lawyers and accountants that could be more productively employed doing things other than avoiding the payment of sums that successful citizens are reluctant to part with, having already paid income tax and corporate tax at least once in the building of their estates.
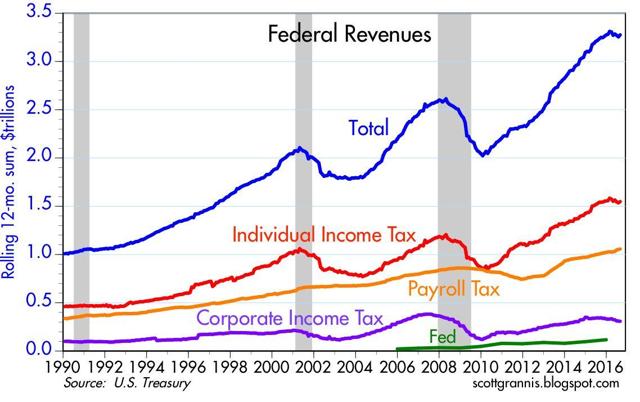
Revenues from estate and gift taxes are not included in the chart above, since they totaled a paltry $21.4 billion in the last 12 months, and represented only 0.6% of total federal revenues for the period. This is the equivalent of a rounding error for the federal government, yet it sustains an army of lawyers and accountants that could be more productively employed doing things other than avoiding the payment of sums that successful citizens are reluctant to part with, having already paid income tax and corporate tax at least once in the building of their estates.
The chart below shows the Federal Debt Burden, which is Treasury Debt Held by the Public (currently $14.1 trillion) divided by nominal GDP (currently about $18.5 trillion).
- It's been higher than today's 76% before, but only as a result of the heavy borrowing needed to finance WWII expenditures.
- Following the end of the war, the debt burden declined rapidly as the economy expanded rapidly and spending fell.
- Things don't look as promising now as they did then.
Many economists have said that the debt burden becomes scary only after it exceeds 100% of GDP but, even then, one can point to Japan and Italy, where debt burdens are well in excess of 100% of GDP and economic life goes on. Whether debt is a real problem depends on a lot of variables.

For now it looks like we are still within the range of "salvation," provided the economy is able to grow more rapidly in the years ahead and entitlement spending is curbed - but there are still a lot of "ifs" to consider.
This article may have been edited ([ ]), abridged (...) and/or reformatted (structure, title/subtitles, font) by the editorial team of munKNEE.com (Your Key to Making Money!) to provide a faster ...
more


My guess would be absolutely no possibility until it becomes impossible to keep borrowing money to fund them. So where does that leave us?
Your last sentence hit the nail on the head. The problem is entitlement spending, mostly Medicare and Medicaid. Steps need to be taking to curb the spending on these programs dramatically going forward or ten years from now, these charts will like truly terrifying.
I agree, but what is the likelihood of actually curbing those entitlements?