
USD/JPY Forecast Jan. 23-27
USD/JPY recorded slight gains last week, as the pair closed at 114.57. This week’s key event is Tokyo Core CPI. Here is an outlook for the highlights of this week and an updated technical analysis for USD/JPY.
In the US, manufacturing and employment numbers beat expectations. The Philly Fed Manufacturing Index continued to climb higher and unemployment claims beat expectations for a fourth straight week. In Japan, manufacturing indicators were a mixed bag.
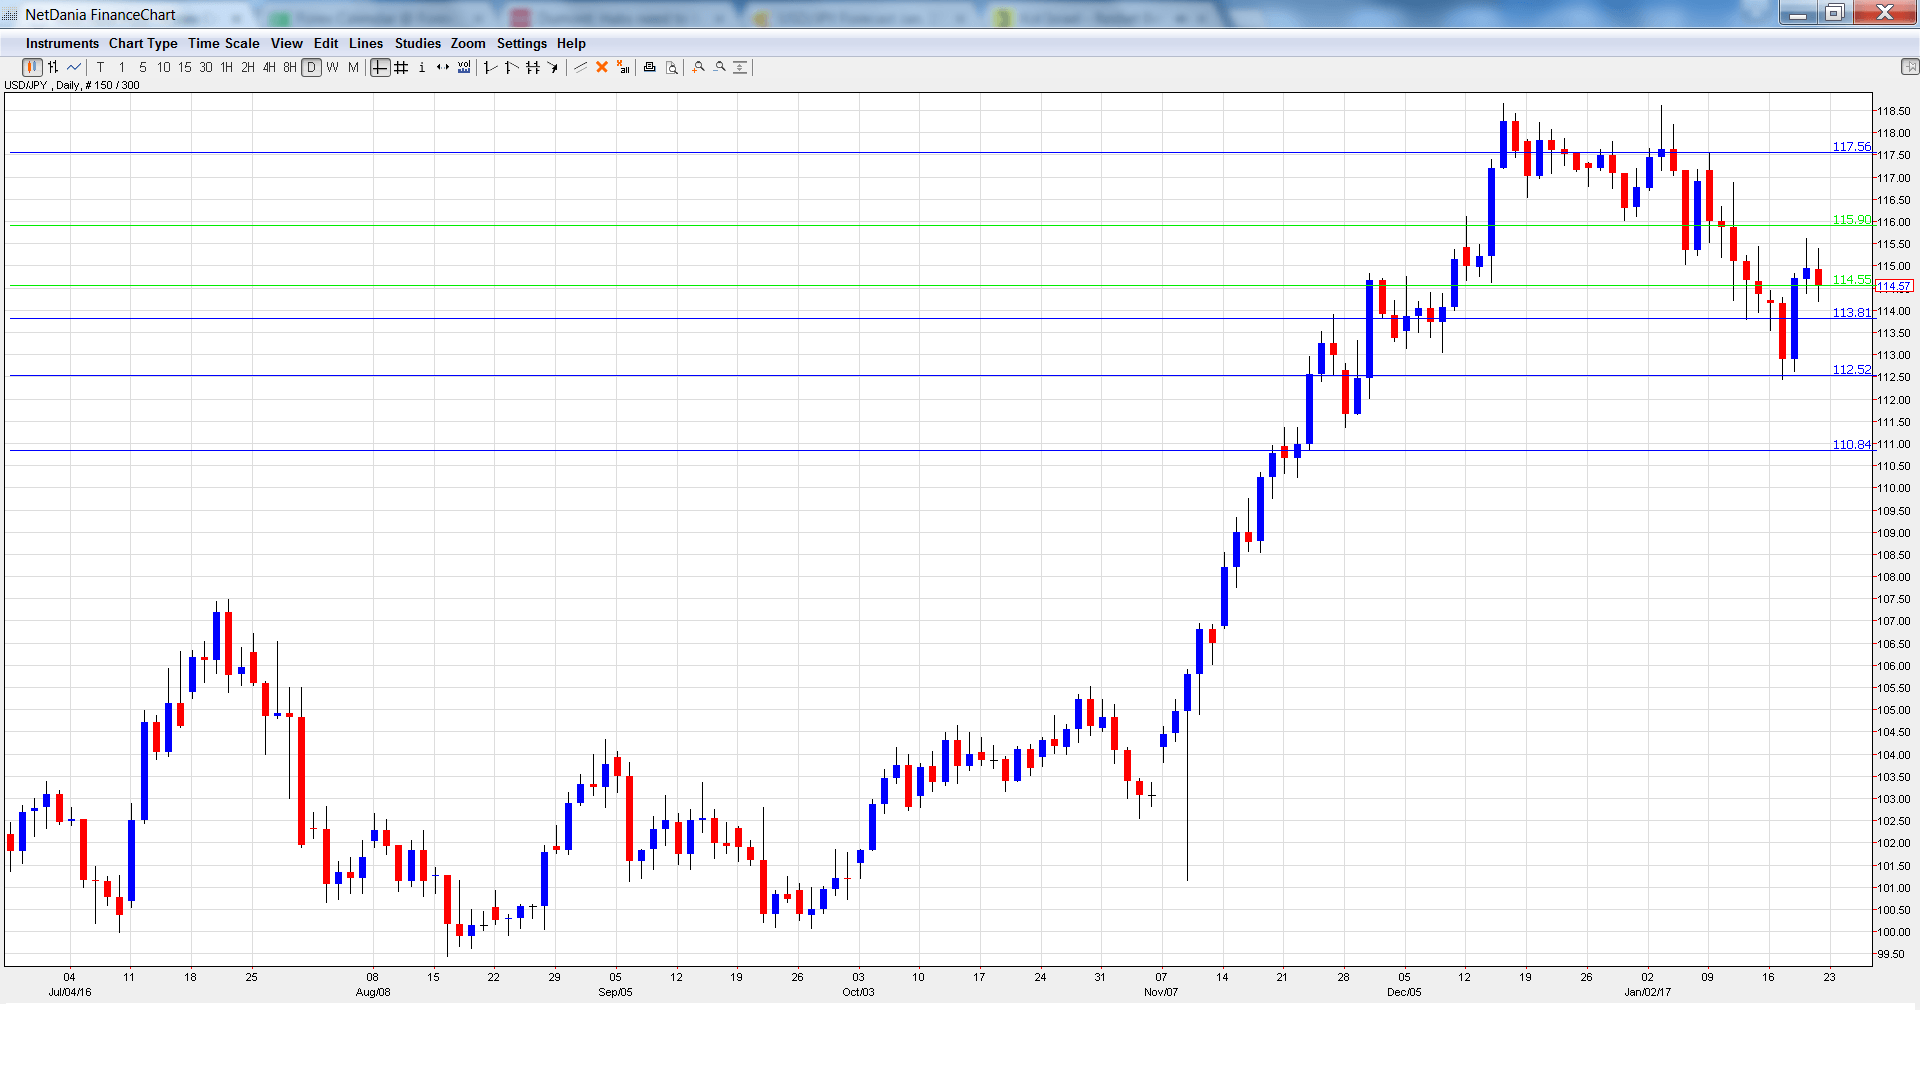
USD/JPY graph with support and resistance lines on it. Click to enlarge:
- All Industries Activity: Monday, 4:30. The indicator has been steady, posting three straight gains of 0.2%. The markets are expecting a stronger reading in November, with an estimate of 0.4%.
- Flash Manufacturing PMI: Tuesday, 00:30. The index continues to show a stagnant manufacturing sector, with readings just above the 50-point level. The indicator climbed to 51.9 points in December, above the forecast of 51.5 points. The upward swing is expected to continue in January, with a forecast of 52.3 points.
- Trade Balance: Tuesday, 23:50. Japan’s trade surplus continues to widen and hit JPY 0.54 trillion in December. This was short of the estimate of JPY 0.59 trillion. The markets are braced for the surplus to narrow to JPY 0.22 trillion.
- SPPI: Wednesday, 23:50. This inflation indicator dipped to 0.3% in November, shy of the forecast of 0.5%. The estimate for SPPI stands at 0.4%.
- Tokyo Core CPI: Thursday, 23:50. This is the key indicator of the week. The index continues to post declines and came in at -0.6% in December, weaker than the estimate of -0.4%. The estimate for the January report stands at -0.4%.
- BoJ Core CPI: Friday, 5:00. This indicator excludes the most volatile items not included in CPI. The index edged down to 0.2%, matching the forecast. The forecast for the upcoming release is 0.1%.
USD/JPY Technical Analysis
USD/JPY opened the week at 114.22. The pair dropped to a low of 112.43 but then rebounded and climbed to a high of 115.62, as 115.90 held firm in resistance (discussed last week). USD/JPY dipped late in the week and closed at 114.57.
Live chart of USD/JPY:
Technical lines from top to bottom:
118.79 was last breached in February 2016.
117.52 is the next resistance line.
115.90 held in resistance at USD/JPY posted strong gains late in the week before retracting.
114.55 is a weak support line. It marked a high point in March 2015.
113.80 is the next support level.
112.53 was a cap in April 2016.
110.83 was the start of a rally in June which saw USD/JPY drop below the 102 line. It is the final support line for now.
I am bullish on USD/JPY
There are concerns as Donald Trump takes over as president, as his economic policies remain unclear. However, the economy is strong and if inflation levels move higher, we could see the Fed step in with another rate step early in 2017.


