
USD/CAD - Will Currency Bears Break Support Line?
In recent days, the greenback moved lower against its Canadian counterpart, which resulted in a decline to the lower border of the rising trend channel. Will this support line withstand the selling pressure in the coming days?
EUR/USD
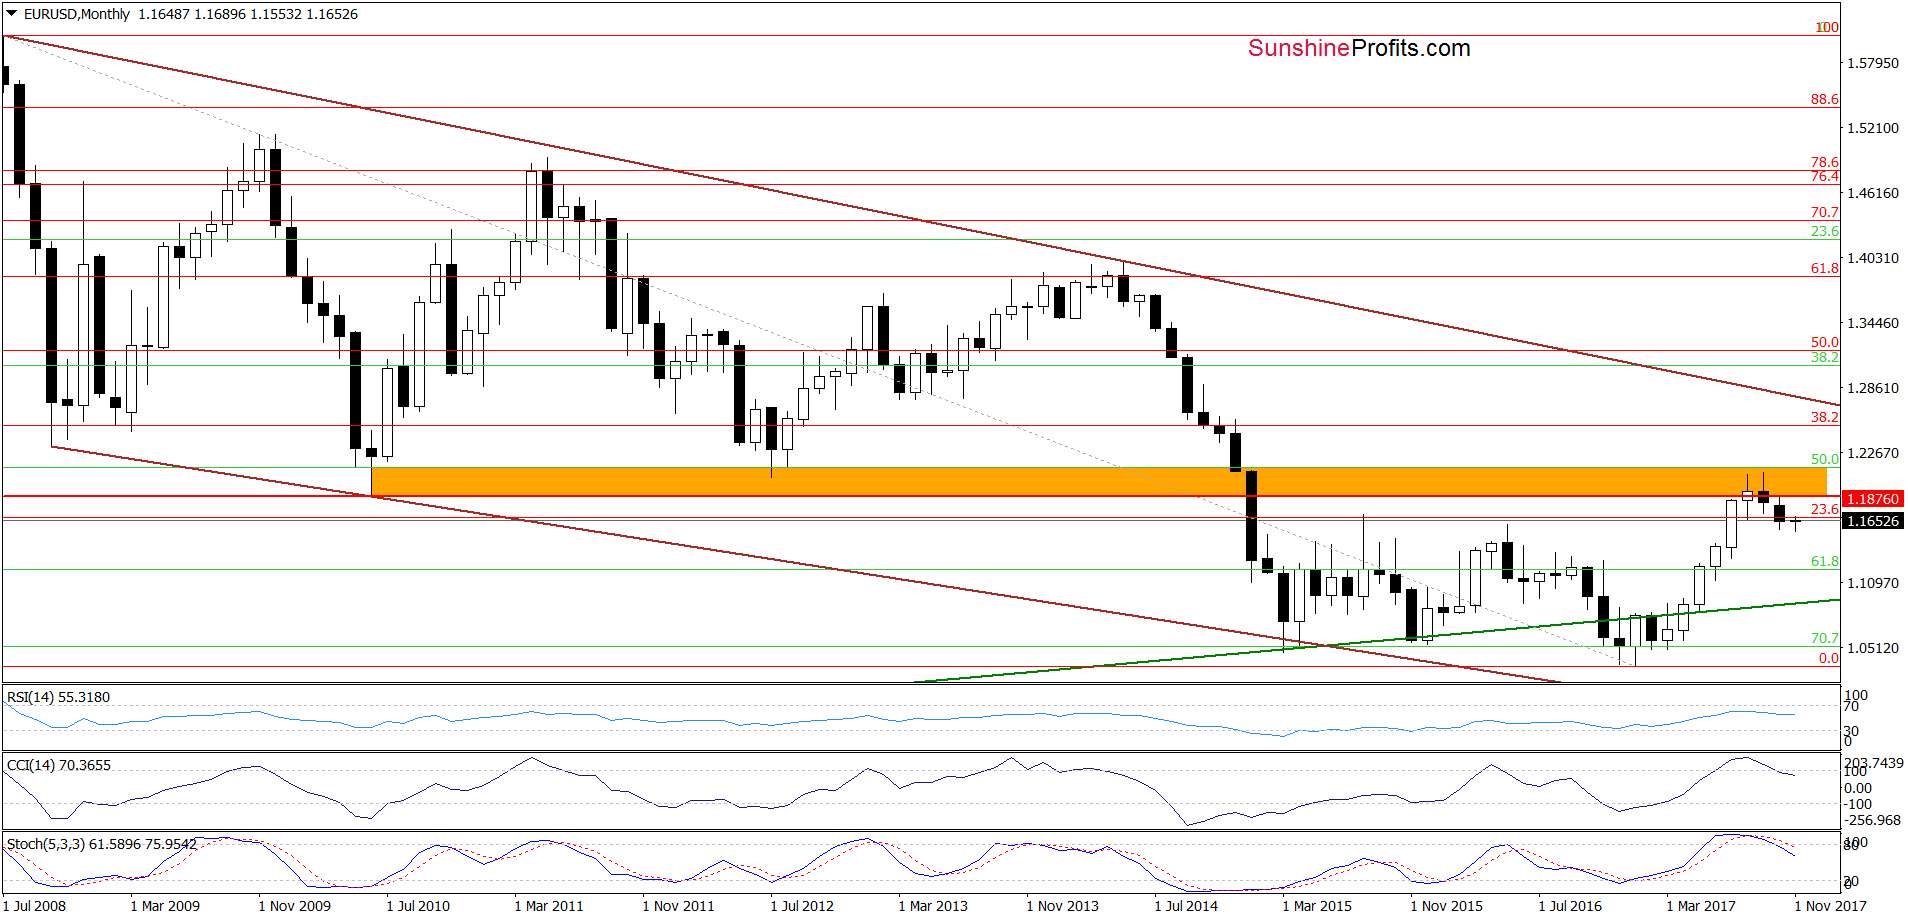
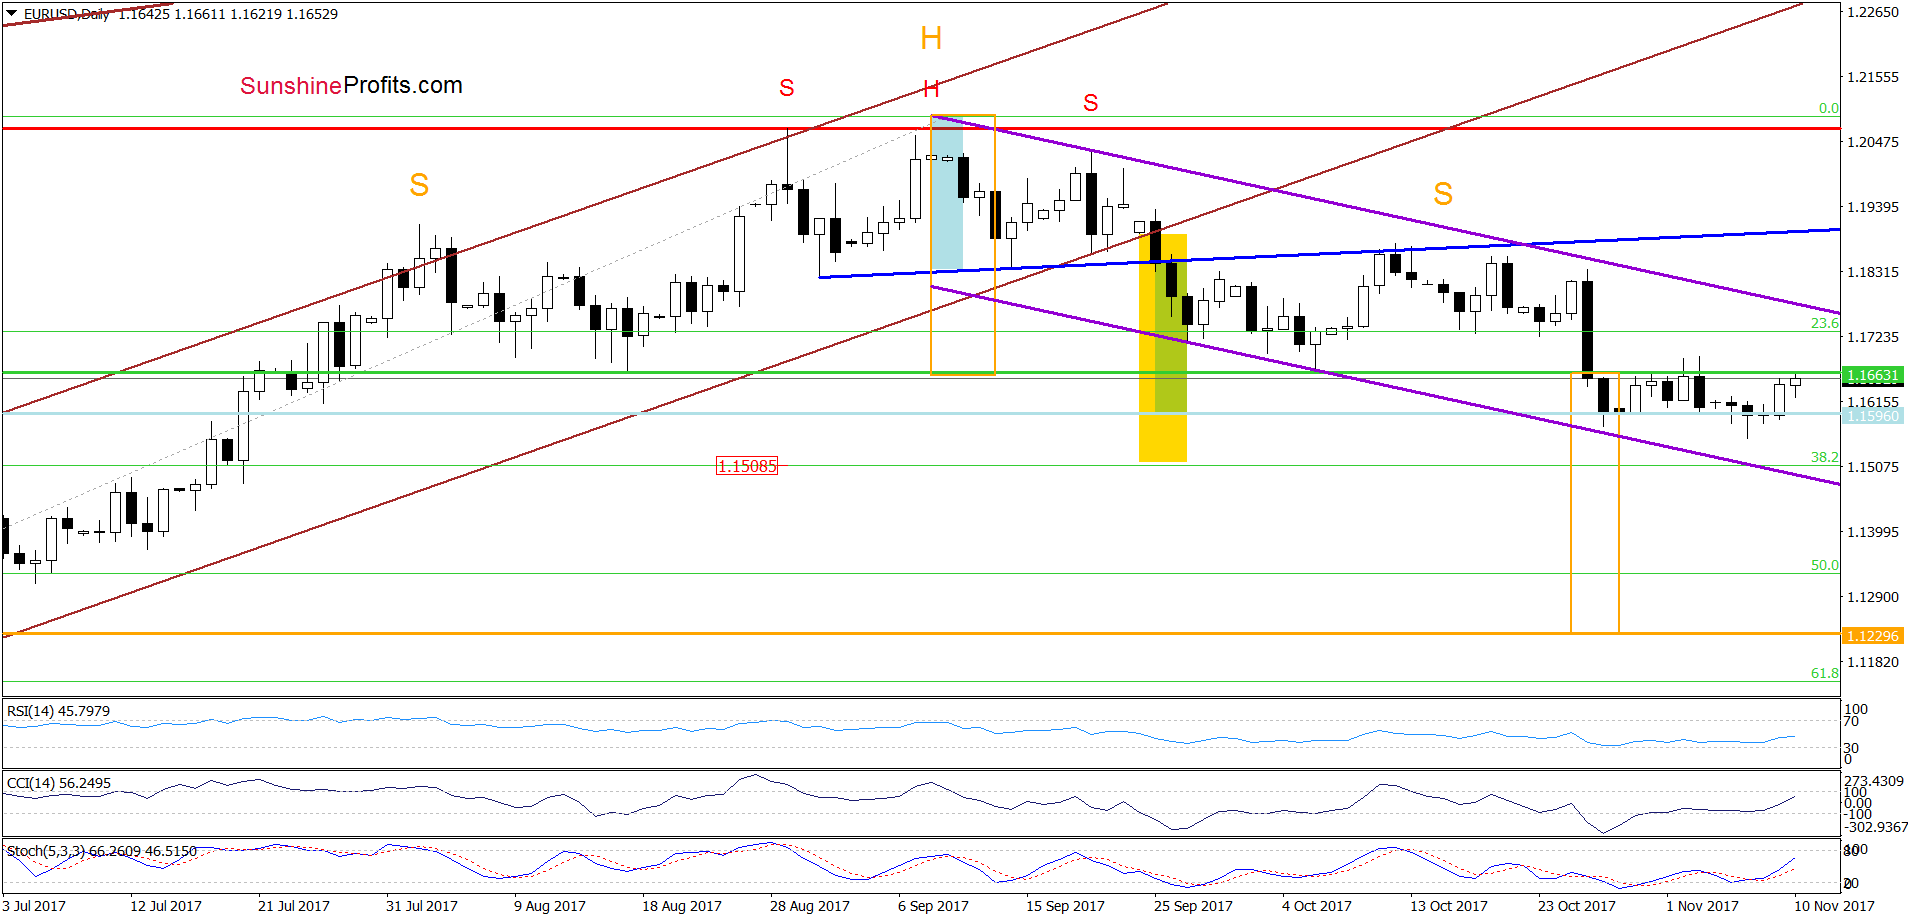
From today’s point of view, we see that EUR/USD extended gains, which approached the exchange rate to the previously-broken green line based on the August and October lows. Similar price action we saw in the previous week, but despite that improvement currency bulls didn’t manage to break above the green line (the nearest resistance and the neckline of the bigger head and shoulders formation), which resulted in further deterioration. Therefore, in our opinion, as long as there is no invalidation of the breakdown under the green line one more downswing and a test of the 38.2% Fibonacci retracement is likely.
Very short-term outlook: bearish
Short-term outlook: mixed
MT outlook: mixed
LT outlook: mixed
USD/CAD
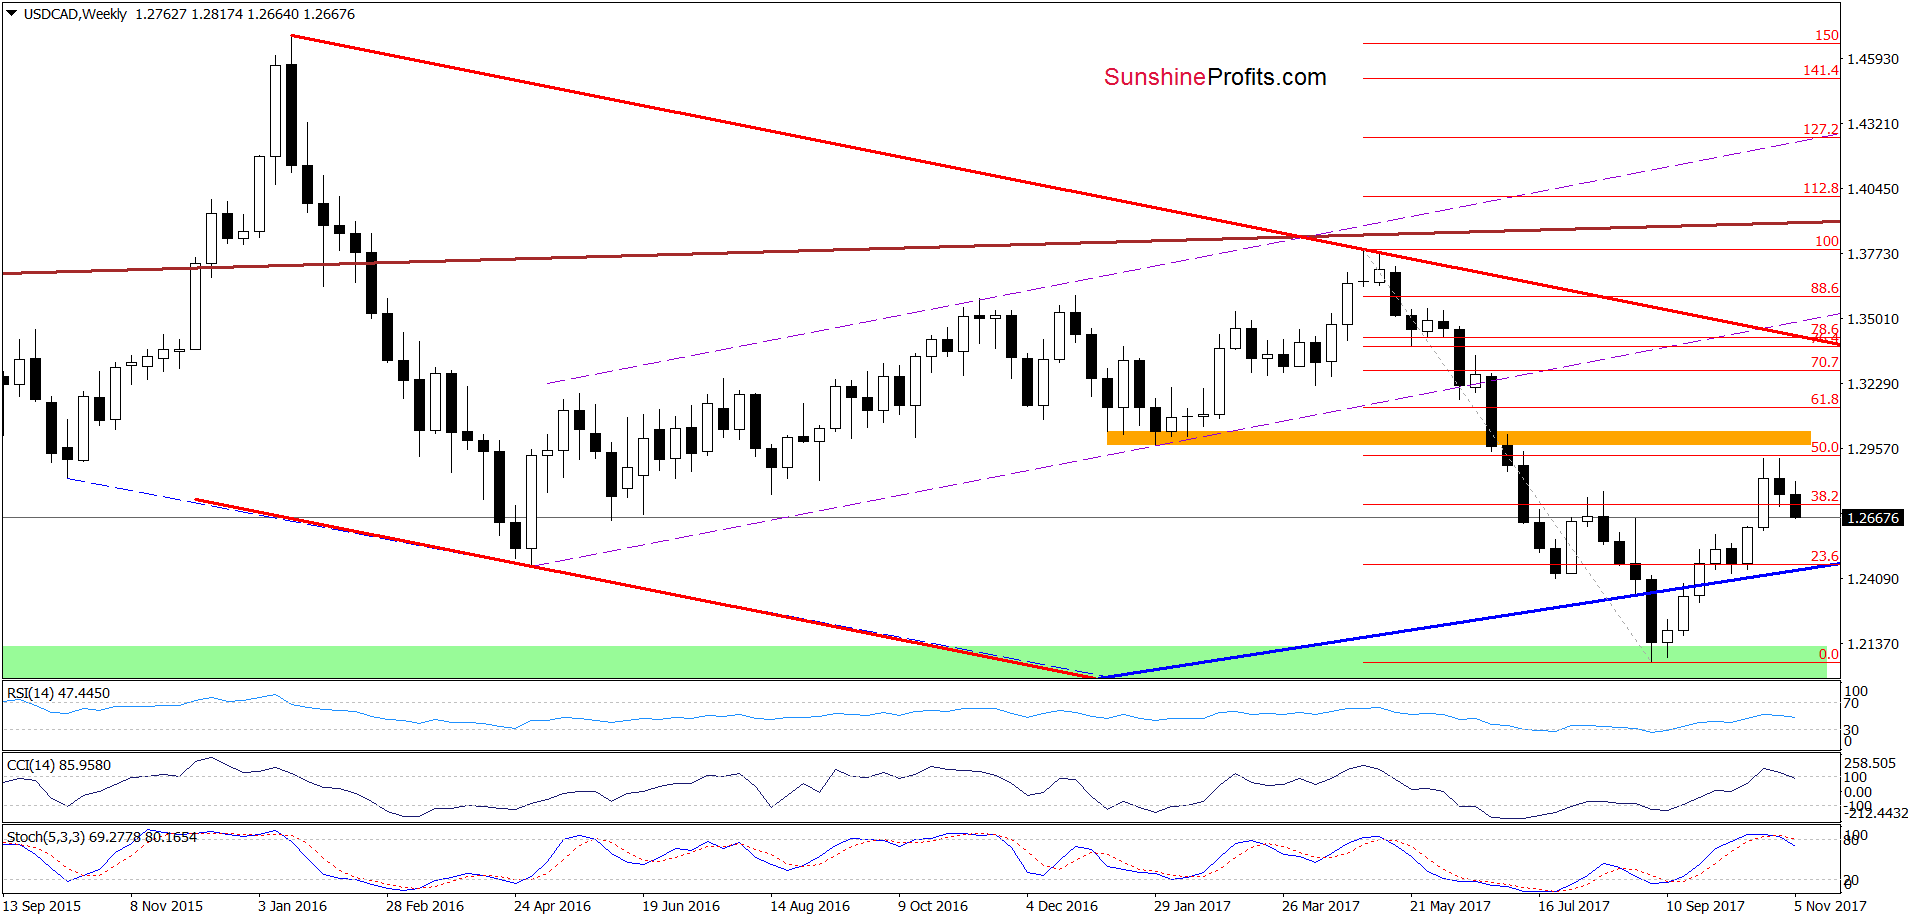
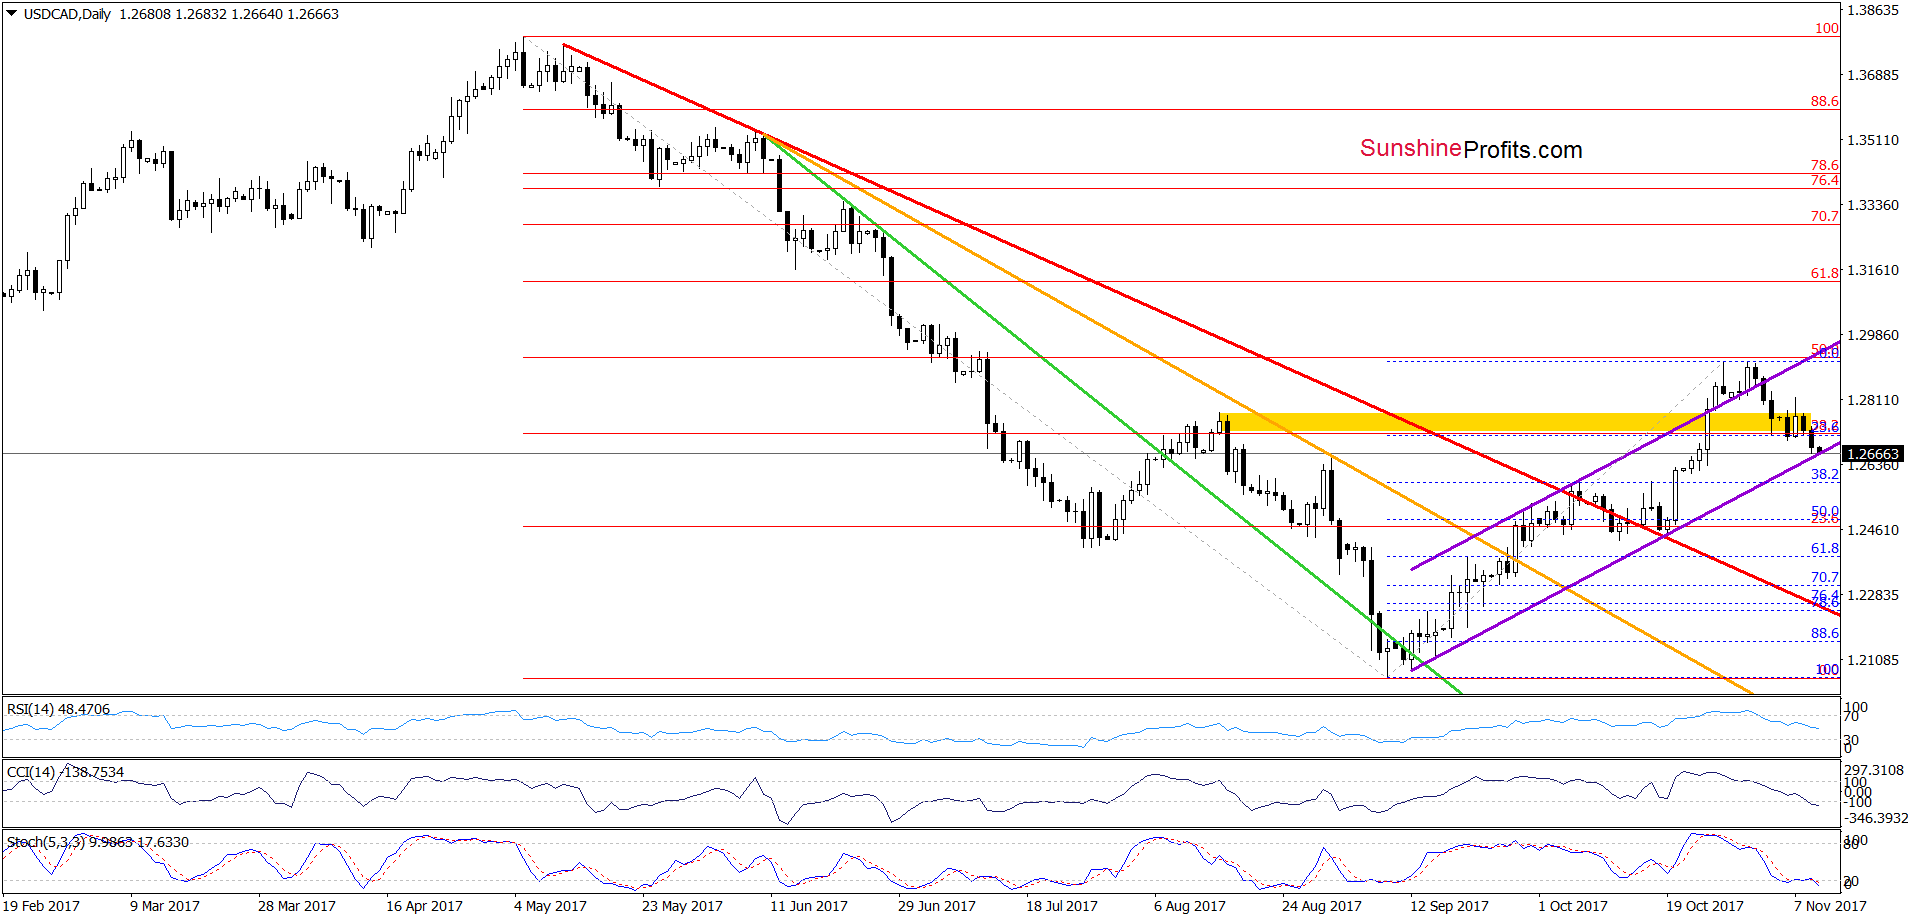
Quoting our Forex Trading Alert posted on Monday:
(…) What’s next for USD/CAD? Taking into account the lack of the buy signals generated by the indicators, it seems that the pair will extend declines and test the lower border of the purple rising trend channel in the following days. Nevertheless, such price action will be likely only if the exchange rate drops under the 38.2% Fibonacci retracement.
Looking at the daily chart, we see that the situation developed in line with the above scenario and USD/CAD slipped to our downside target.
Will we see further deterioration in the coming week? Taking into account the fact that the sell signals generated by the indicators remain in cards, we think that currency bears will try to push the exchange rate to the 38.2% Fibonacci retracement in the very near future. At this point, it is worth noting, that this area is also supported by the October highs, which could stop declines. Nevertheless, if currency bulls do not take action in this area, we could see a drop even to around 1.2431-1.2488, where the 50% retracement and mid-October lows are.
Finishing today’s commentary on this currency pair, please keep in mind that this pro-bearish scenario will be more likely and reliable if the exchange rate closes today’s session (or one of the following sessions) under the lower border of the purple rising trend channel.
Very short-term outlook: mixed with bearish bias
Short-term outlook: mixed
MT outlook: mixed
LT outlook: mixed
USD/CHF
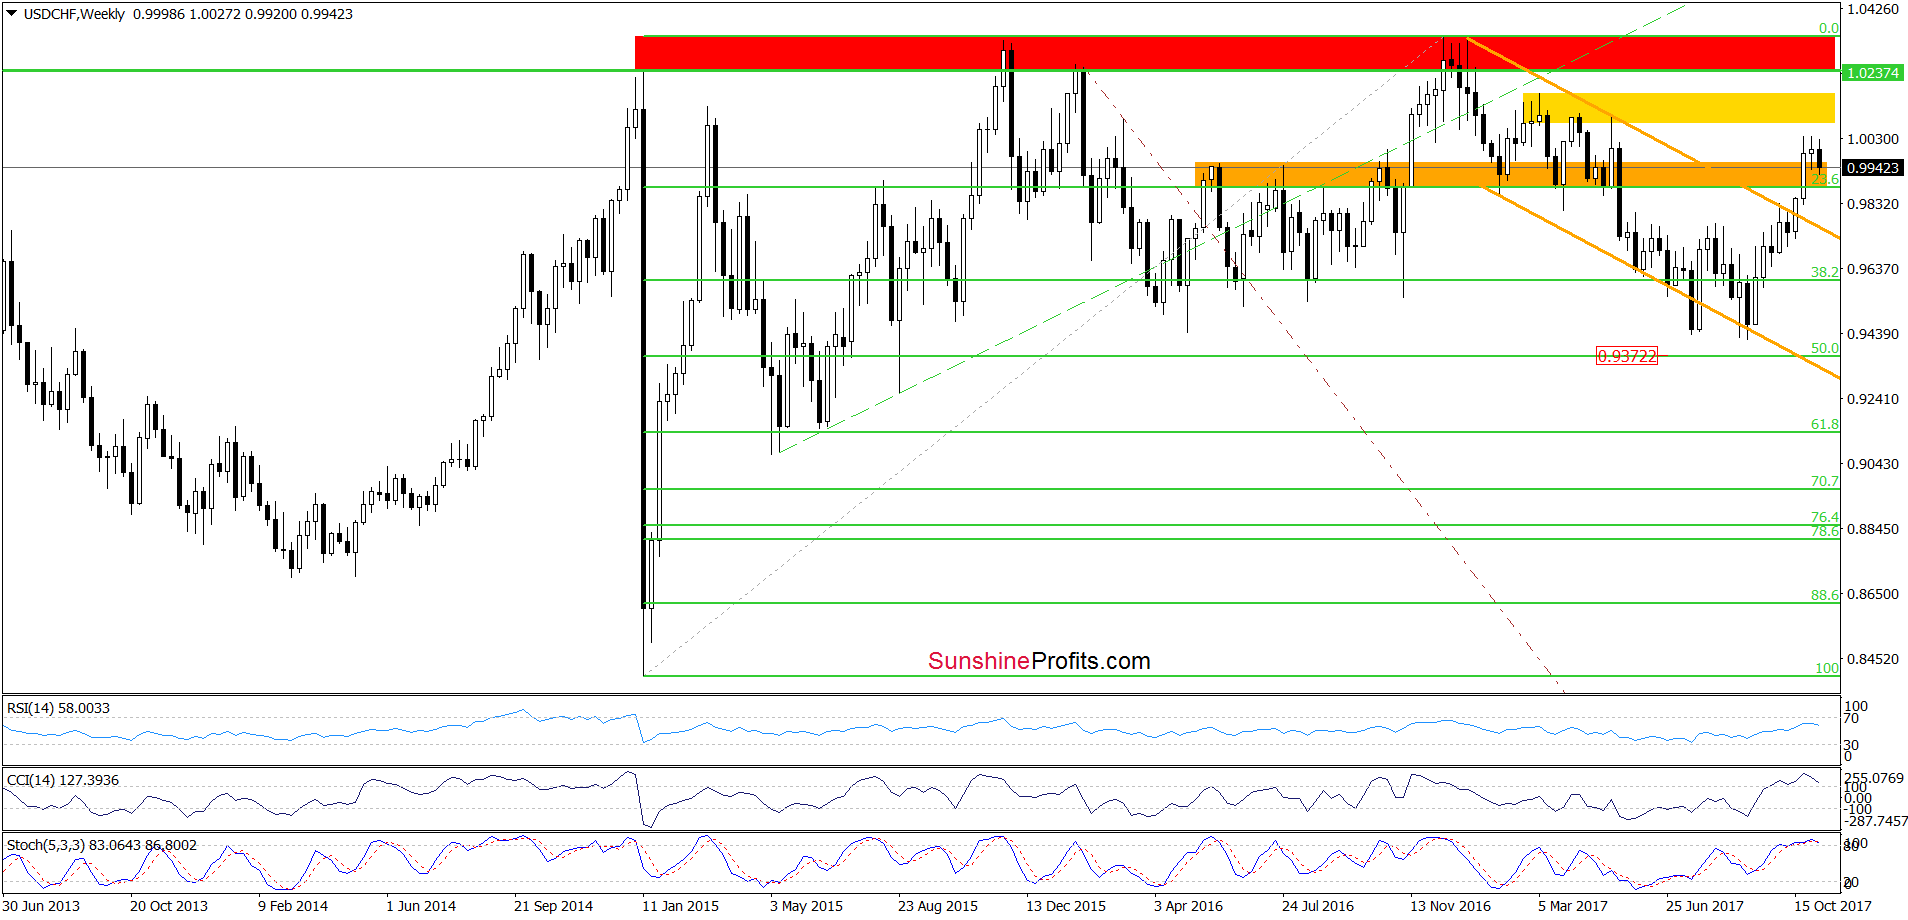
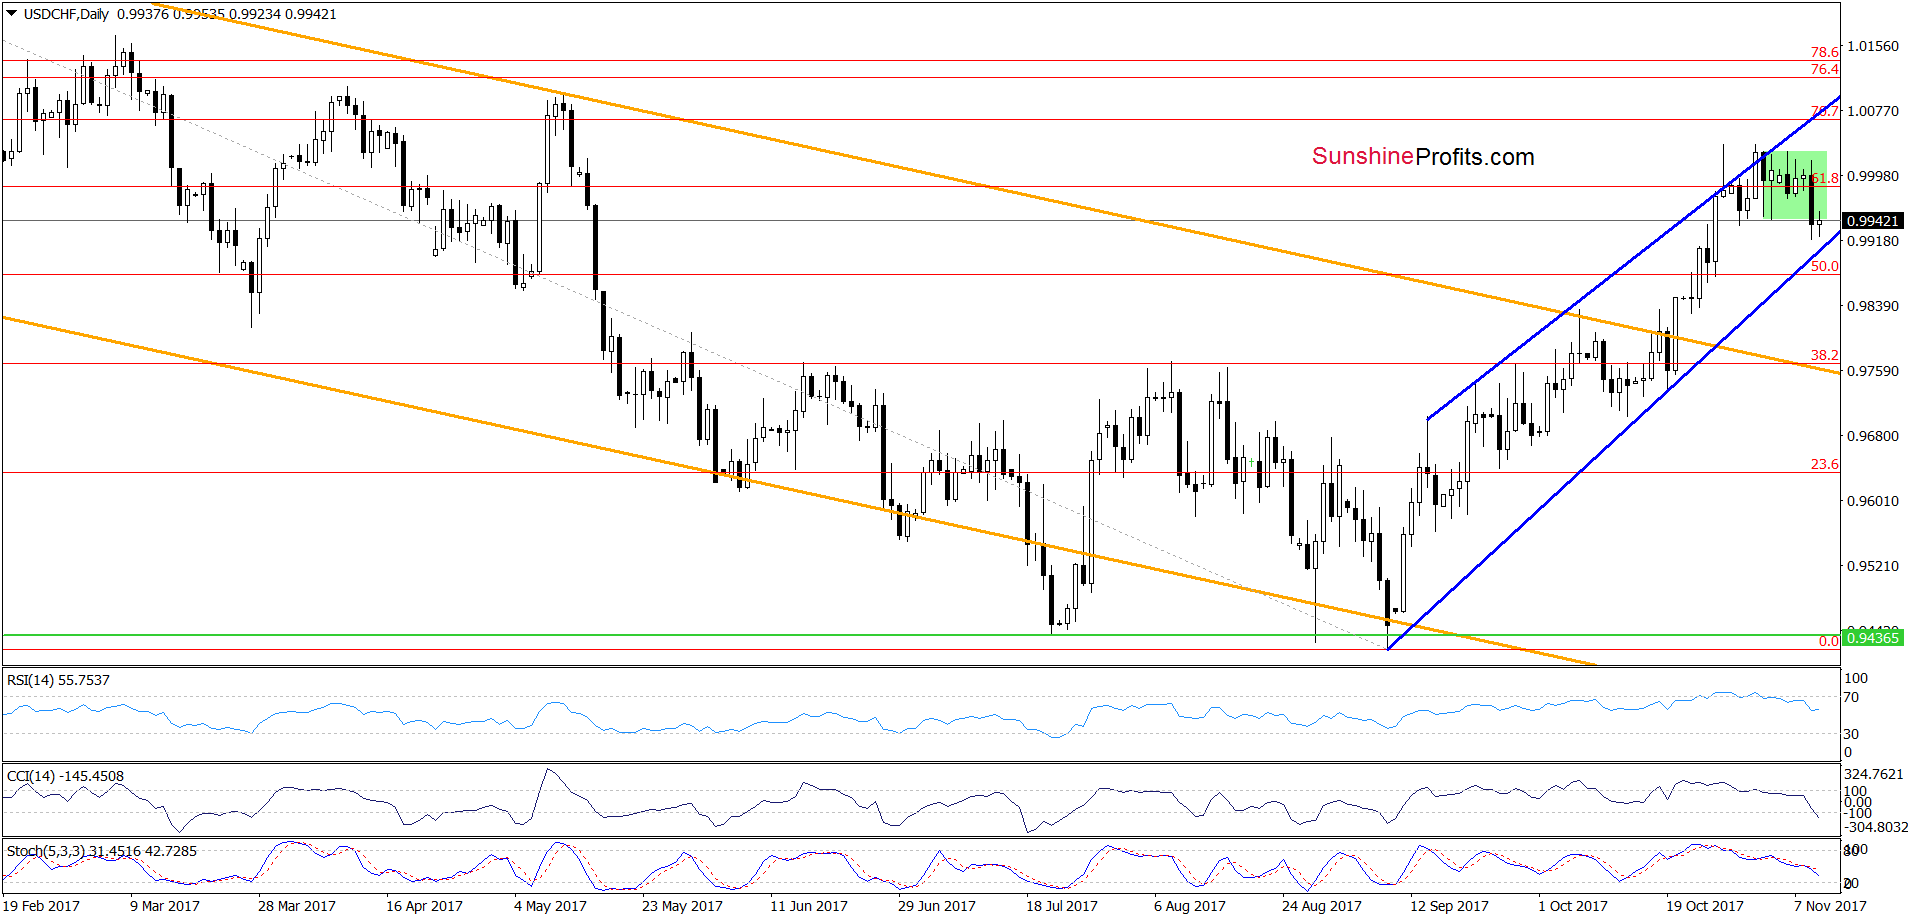
On Tuesday, we wrote the following:
(…) Where will the exchange rate head next? Taking into account the sell signals generated by the daily indicators and two invalidations of the breakout above the upper border of the blue rising wedge, it seems that the pair will test the lower border of the formation in the coming week. (…)
Yesterday, USD/CHF moved sharply lower, which resulted in a breakdown under the lower border of the green consolidation. Taking this bearish development and the lack of buy signals generated by the indicators, we think that we’ll see a realization of the above scenario in the very near future.
Very short-term outlook: mixed with bearish bias
Short-term outlook: mixed
MT outlook: mixed
LT outlook: mixed


