
Ups And Downs
Feeling bullish? Bearish? It doesn’t matter. I’ve got something for everyone today.
I’ve assembled below some interesting charts that help provide fodder for either argument. I’ll leave it to your judgment to determine which ones matter the most.
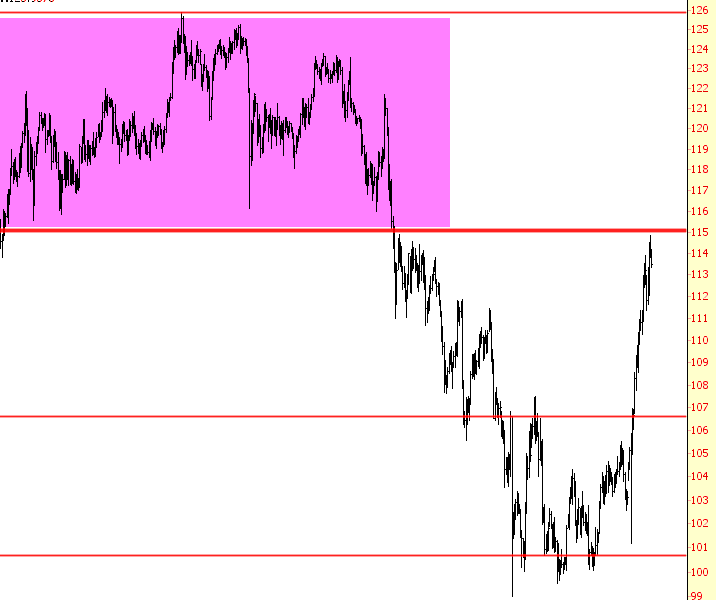
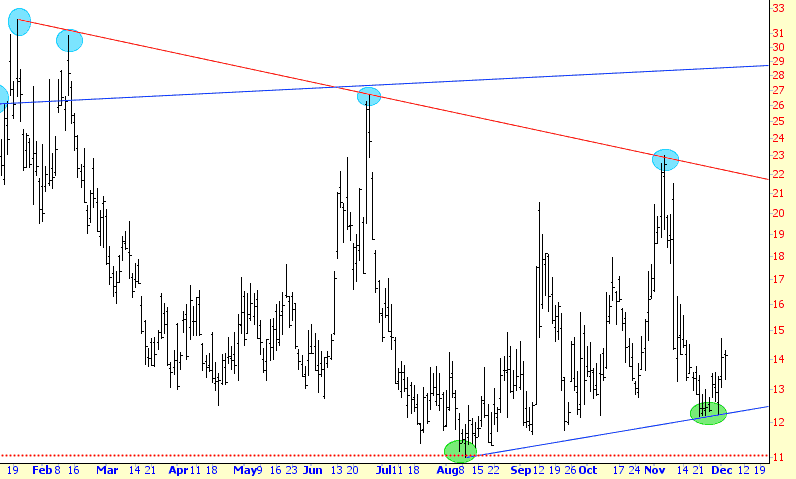
The first one is bearish, which is the USD/JPY. I think this is heading lower, and that would help drag equities down with it.
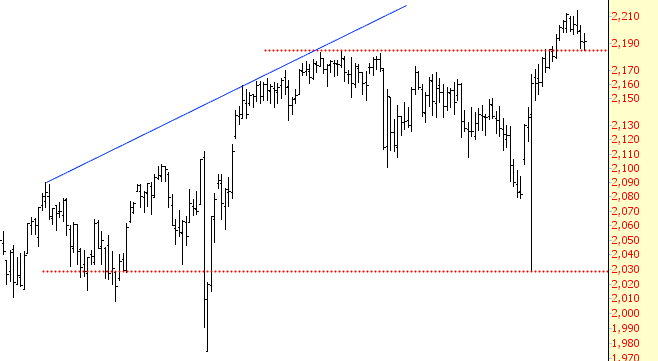
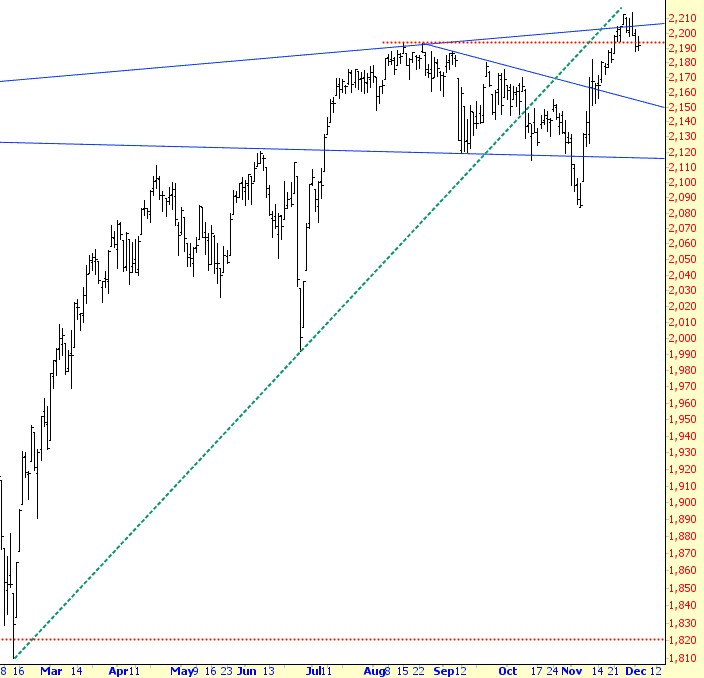
The ES, on the other hand, remains bullish. It had a breakout above the upper horizontal drawn below. As long as it stays above it (which good ol ‘Tim hopes doesn’t happen), the bullish formation is intact. Otherwise, it’s failed bullish breakout time.
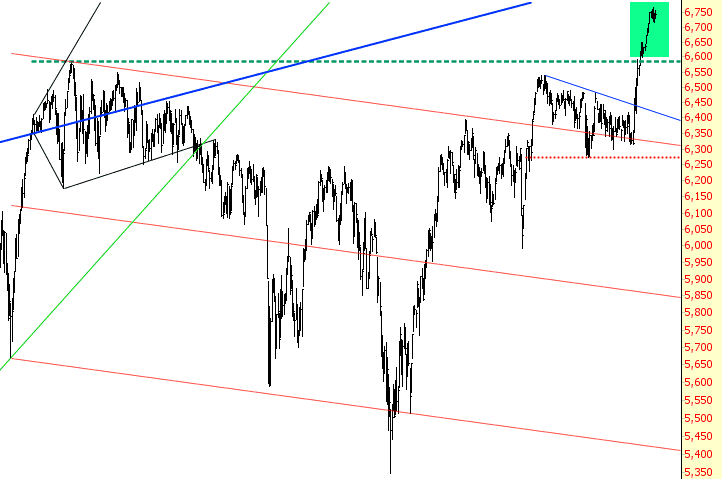
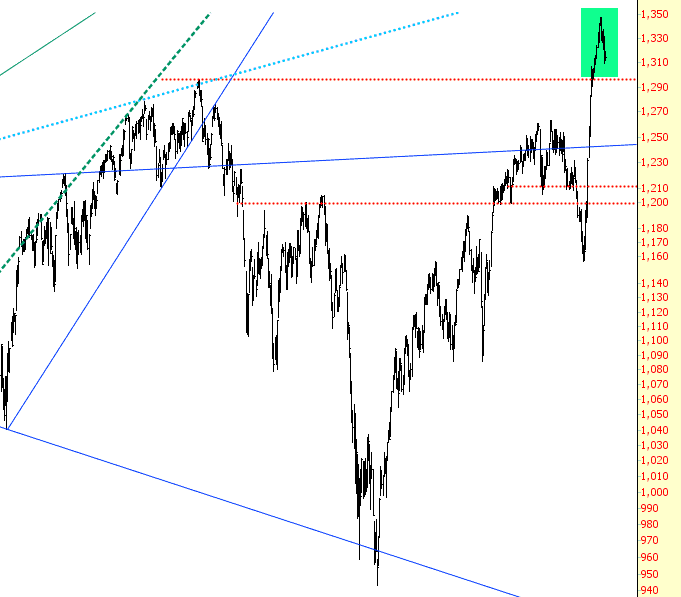
Another one for the bulls is the Dow Composite, which broke above the dotted green horizontal shown below, and it’s been steadily lifting higher (green tint) ever since in the Trump rally.
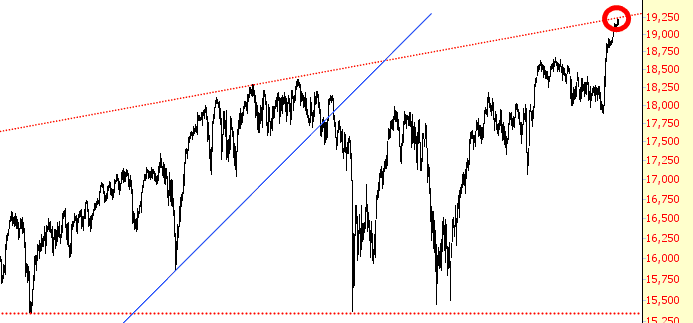
The most important element of the Dow Composite, of course, is the Dow Industrials, which has taken a trendline that goes back for decades. This could be the point of exhaustion.
The most explosive rally since the election has been the Russell 2000, which has also blasted above its own horizontal price into record high territory (although it’s eased back a little lately). Here again, it needs to stay above that horizontal for the breakout to remain valid.
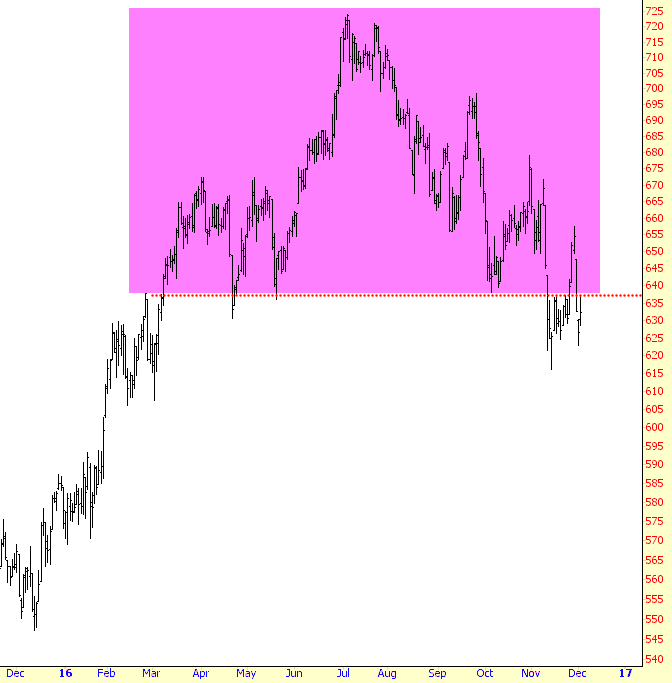
On the other hand, the S&P 500 is already starting to fracture. It has never managed to get back above the dotted green line shown below, and it has even retreated from its modest breakout.
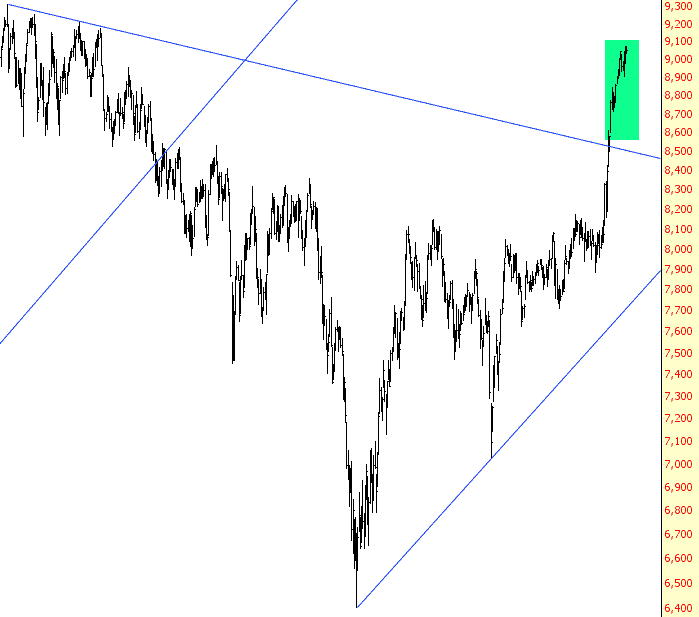
Perhaps the most surprising breakout of all has been the Dow Transports. Once it got above its descending trendline, it hasn’t bothered looking back.
So we’ve seen the Composite is bullish, the Transports are bullish, but the Industrials are bearish. What about the final element, the Utilities? They’re the most bearish of all:
I would also say that volatility is poised to accelerate. I personally think Trump is going to muck up this country in ways unimaginable, and volatility is going to come very much back into style for years to come.
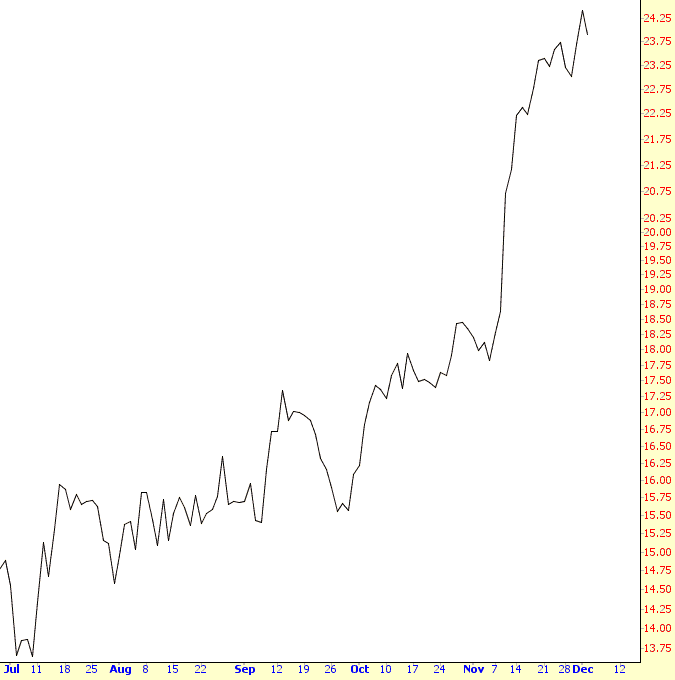
Lastly, interest rates – the graph below says it all. They are skyrocketing, and the free ride that the central bankers have enjoyed for the past 8 years are about to come to a thermonuclear halt. The losses the central bankers have suffered (and I use that word with glee) are well in excess of one TRILLION dollars at this point, and the ruinous situation they have brought to the entire world will soon be revealed.
Disclosure: None.


don't let your Trump hate bias your observations. you will bias on the negative. stay agnostic. You don't know the future so let it go. Market is clearly bipolar. loved your charts. They tell it all don't they?
There is more risk to the downside with Trump than the upside. However, I think he did two things that were positive. He is talking about 100-year bonds, although the guy talking is a foreclosure CEO, not good for confidence of homeowners. Second, he is wanting manufacturing businesses that can be profitable to stay in the USA. But he needs to be careful, letting companies go that cannot compete worldwide without sending some jobs offshore.
that second chart the ES- what is the ES?
Thanks for sharing