
T2108 Update– An Ominous Close Call For The Extended Overbought Rally
Today was a close-call for this now 43-day old overbought period. For the second day in a row, sellers got active. This selling flared right after I wrote about the market’s proven resilience with T2107, the percentage of stocks trading above their respective 200DMAs, reaching new rally highs despite the difficulties in tech stocks. Buyers rallied just enough into the close to keep T2108, the percentage of stocks trading above their respective 40DMAs, above the overbought threshold of 70%.
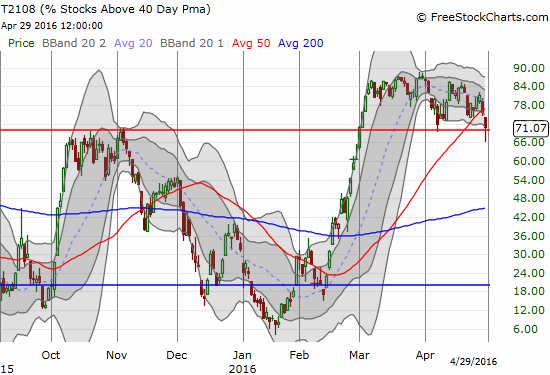
Ever so slowly, T2108 is getting “heavier.” A break of overbought status looks imminent!
T2108 has spent almost two months churning around in overbought territory. A very subtle downtrend has taken hold with today’s brief break of overbought status confirming the indicator’s increasing “heaviness.” I am keeping my trading bias at cautiously bullish, but a complete break of overbought status seems imminent. This juncture is important because the end of an extended run in overbought conditions typically happens at the front end of a sell-off. Interestingly, the S&P 500 is now under-performing projections of performance for an overbought period of 43 days in length.
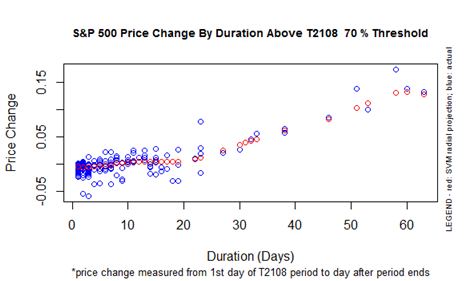
S&P 500 Performance By T2108 Duration Above the 70% Threshold
The good news is that each day of duration for this overbought period linearly adds to the expected performance of the S&P 500 (SPY). The S&P 500 has gained 4.4% so far during this overbought period. This performance runs below the roughly 6% to 7% I expect from this overbought period. To meet expectations, the S&P 500 will need to springboard from this 2-day sell-off to go on a freshly invigorated run-up. Such a bounce would be consistent with the hammer like candlestick pattern from Friday’s trading. Small bounces have followed other similar hammer patterns in recent months.
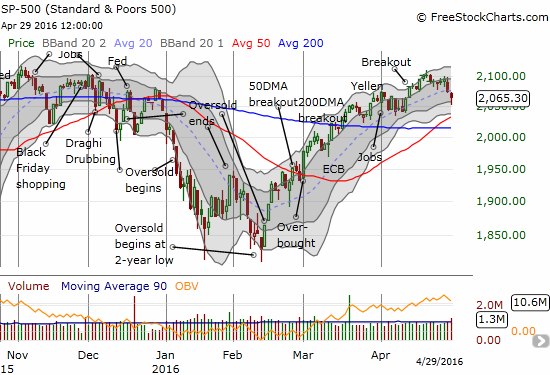
The S&P 500 (SPY) breaks support at its 20DMA, but the index manages to bounce of a lower-Bollinger Band (BB)
The NASDAQ (QQQ) also bounced, but the tech-laden index sits in a much more precarious position than the S&P 500. If T2108 breaks overbought territory, I will first target tech stocks for more bearish trading strategies because such bearishness will likely find confirmation of the current 200DMA and 50DMA breakdowns.
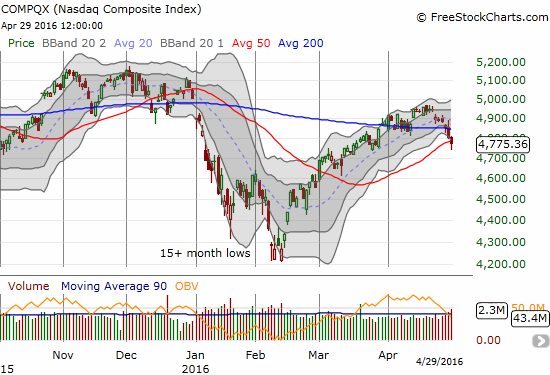
The NASDAQ broke 200DMA support on Thursday (4/28) and followed that up with an even more ominous 50DMA breakdown. Buying off the lows did not manage to avert the breakdown.
The volatility index came to life again with the selling. Today, the VIX soared all the way through the 15.35 pivot point before fading back to 15.70. This move confirms sellers are getting restless. I countered with a small purchase of shares in ProShares Short VIX Short-Term Futures (SVXY) and put options in ProShares Ultra VIX Short-Term Futures (UVXY) in anticipation of the first day of trading in May. The first trading day of the month tends to deliver gains, particularly following strong bouts of selling. For example, since the bounce from oversold conditions in October, the first trading day of the month has delivered gains 5 of 7 months. The two months that started with selling were January and February. Needless to say, if May manages to start with selling, the bearish scenario I discussed above will trigger.
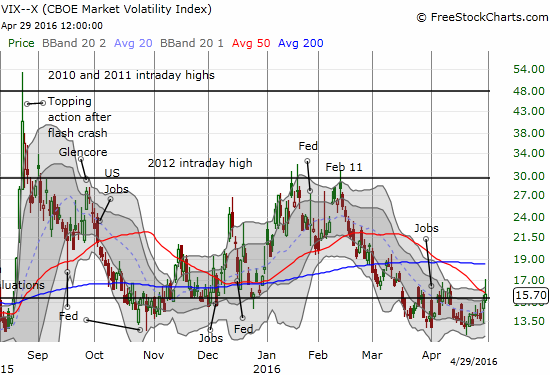
Volatility comes alive as sellers get antsy.
Finally, as if we need any more ominous charts, the Australian dollar (FXA) versus the Japanese yen (FXY) ended at its lowest close during this overbought period. This is close is yet another close call. A few more “inches” lower, and AUD/JPY will add a LOT more weight to the bear case.
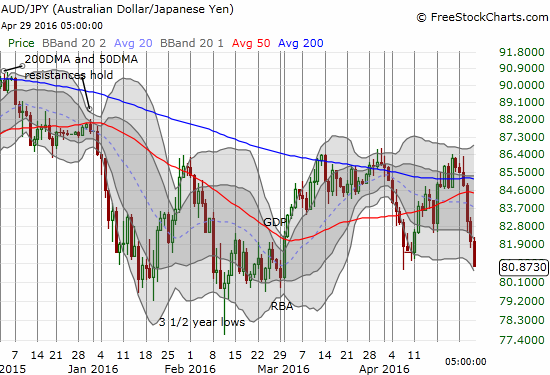
AUD/JPY completely plunged over the past week – a very ominous sign.
— – —
For readers interested in reviewing my trading rules for an oversold T2108, please see my post in the wake of the August Angst, “How To Profit From An EPIC Oversold Period“, and/or review my T2108 Resource Page.
Reference Charts (click for view of last 6 months from Stockcharts.com):
S&P 500 or SPY
U.S. Dollar Index (U.S. dollar)
EEM (iShares MSCI Emerging Markets)
VIX (volatility index)
VXX (iPath S&P 500 VIX Short-Term Futures ETN)
EWG (iShares MSCI Germany Index Fund)
CAT (Caterpillar).
IBB (iShares Nasdaq Biotechnology).
(Reload page and/or click on the image, if it is not correct. At time of writing, server is having cache issues)
Daily T2108 vs the S&P 500

Black line: T2108 (measured on the right); Green line: S&P 500 (for comparative purposes)
Red line: T2108 Overbought (70%); Blue line: T2108 Oversold (20%)
Weekly T2108

*
All charts created using freestockcharts.com unless otherwise stated.
(T2108 measures the percentage of stocks trading above their respective 40-day moving averages [DMAs]. It helps to identify extremes in market sentiment that are likely to reverse. To learn more about it, see my T2108 Resource Page. You can follow real-time T2108 commentary on twitter using the #T2108 hashtag. T2108-related trades and other trades are occasionally posted on twitter using the #120trade hashtag. T2107 measures the percentage of stocks trading above their respective 200DMAs)
T2108 Status: 71.1% (66.0% at the intraday low)
T2107 Status: 59.9%
VIX Status: 15.7 (17.1 at the high)
General (Short-term) Trading Call: cautiously bullish
Active T2108 periods: Day #55 over 20%, Day #54 over 30%, Day #51 over 40%, Day #48 over 50%, Day #44 over 60%, Day #43 over 70% (Thursday ended 11 days over 80%) (overbought)
The charts above are the my LATEST updates independent of the date of this given T2108 post. For my latest T2108 post click here.
Related links:
The T2108 Resource Page
Expanded daily chart of T2108 versus the S&P 500
Expanded weekly chart of T2108
Disclosure: long SVXY, long UVXY ...
more


It seems clear the market is oscillation between a very wide range making the fact it is coming down from the top of an oscillation a pretty straightforward play. Frankly, I'm amazed more people aren't playing it this way. If it declines slowly, it gives you time to bet the range even if you don't want to bet the lower lows trend.