
T2108 Update – Buyers Draw A Line In The Sand
Buyers drew a line in the sand after sellers tried to put a negative spin on the April U.S. jobs report. T2108, the percentage of stocks trading above their respective 40DMAs, dipped as low as 55.4% before closing at 61.7%. More importantly, the S&P 500 (SPY) broke below its 50-day moving average (DMA) before closing near its highs for a 0.3% gain. That tiny gain was the most important gain in what has become 6-weeks and counting of churn. The small intraday bounce happened right at the bottom of this churn.
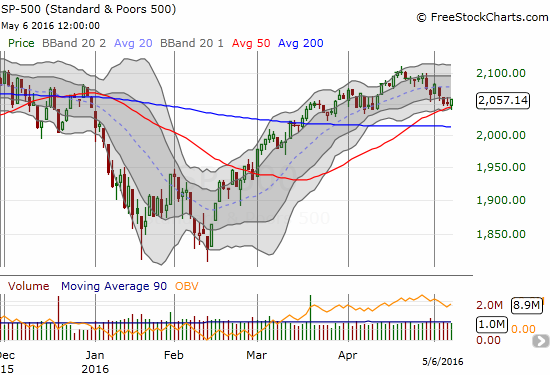
The S&P 500 (SPY) survives a test of its 50DMA support as buyers draw a line in the sand.
With this successful test of 50DMA (and range) support, my conviction on my bearish call weakens a bit. That conviction is even more wobbly after I closed out a series of successful bearish trades to start the week only to fail at all my bearish trades to end the week.
The volatility index, the VIX, flipped below the 15.35 pivot and no longer looks poised to launch higher. So, volatility comes off the wall of potentially bearish signs.
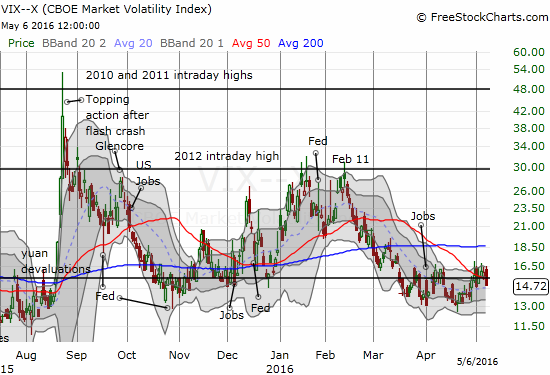
The VIX folded to end the week.
While the case for the bears is less convincing, the case for the bulls is only slightly better. I cannot return to the bull until/unless T2108 returns to overbought status. Such a move would demonstrate a return of buying power to the market. However, I would still tread carefully if an overbought period began with the S&P 500 right under or at its recent high. So, T2108 is once again very useful for signaling trades and sentiment. T2107, the percentage of stocks trading above their respective 200DMAs, gained fractionally. Like T2108, this indicator is in a downtrend from recent highs.
Caterpillar (CAT), my favorite hedge against bullishness, cracked 50DMA support this week and added to my bearishness at the time. I took advantage of today’s rally to enter into put options that expire in August. I am assuming confirmation of CAT’s breakdown – a subsequent breakdown below the 200DMA – will take some time…unless of course sellers get serious again.
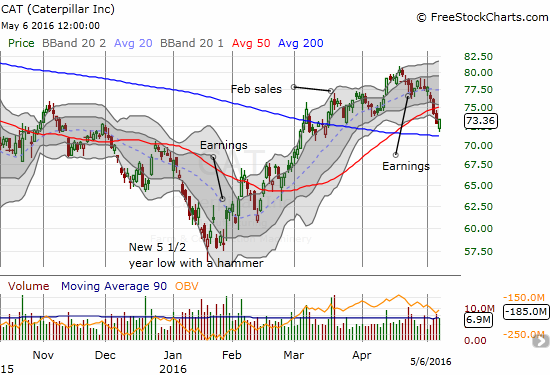
Caterpillar (CAT) gets a bounce near 200DMA support.. The stock is still in the middle of an accelerated breakdown below 50DMA support.
The iShares Nasdaq Biotechnology ETF (IBB) was the biggest disappointment of the week. IBB failed to hold support at its 50DMA and has officially invalidated the breakout from consolidation. The ETF is right back into bearish territory.
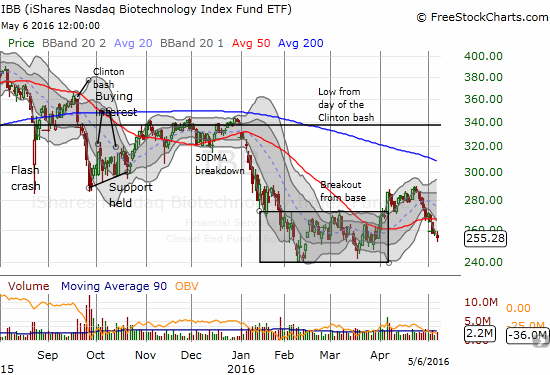
iShares Nasdaq Biotechnology (IBB) is back into bearish territory with another 50DMA breakdown
Tesla (TSLA) has broken down into bearish territory. First, the stock peaked with the hype over reservations for the Model S. The stock sold-off steeply going into earnings and broke down support at its 50 and 200DMAs. Post-earnings, the stock confirmed the breakdown with even more selling on very high volume. I am actively watching TSLA for hints on the market’s appetite for speculation. Right now, its sentiment looks poor as TSLA’s chart noticeably wilts.
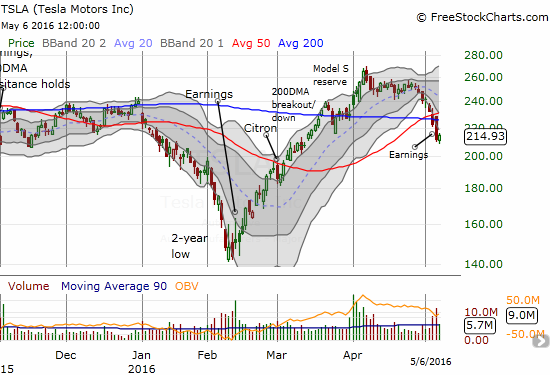
Tesla Motors has broken down after a run-up that took it to about a 78% run-up in just under 2 months from the February lows.
There are a few notable big cap tech stocks that are suddenly showing life again. In particular, Alphabet (GOOG) (GOOGL) surged off 200DMA support. I was convinced all week that it would follow through on last Thursday’s break, but the stock held firm. GOOG now looks good for a test of presumed resistance at the 50DMA. After that, GOOG can look forward to filling its post-earnings gap down.
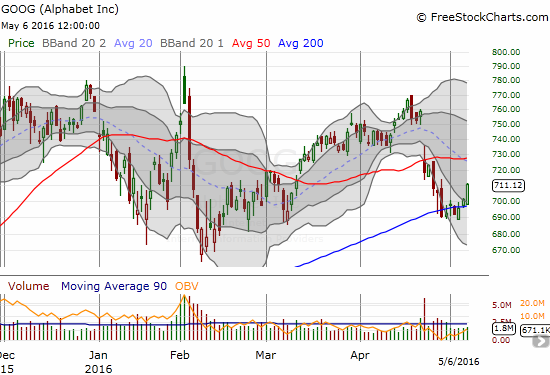
Alphabet gets a bounce near 200DMA support.. The stock is still in the middle of an accelerated breakdown below 50DMA support.
International Business Machines (IBM) is an interesting case. Stocks like this make me think the market is going to deliver many months of churn that excites bears and frustrates bulls and then the reverse. IBM has been dropping ever since its all-time high a little over 3 years ago; the stock is still in a downtrend from that peak. Yet, the rebound off 6-year lows has been dramatic and sharp enough to suggest that perhaps, just maybe, sentiment is turning. That rebound lasted 6 weeks. The cooling off period since then has found support from a declining 200DMA. If the market goes into a “non-bearish” mode, IBM could churn above this support for many more weeks until perhaps July earnings provides a jolt. The more immediate issue is a declining 20DMA. If IBM manages to break above recent highs, I will assume it is going into a fresh run-up. A breakdown below 200DMA support would be VERY bearish: like TSLA, the previous run-up was so fast and steep that there is no point of natural support on the way back down.
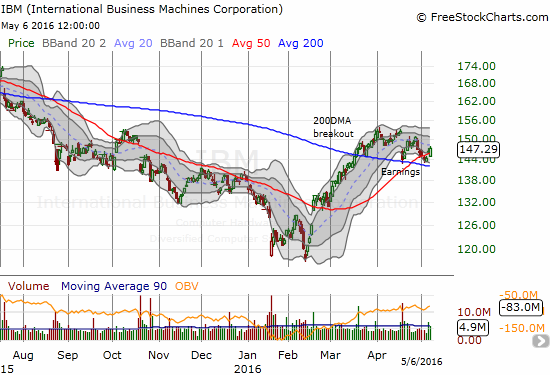
International Business Machines (IBM) is fighting to hold onto 200DMA support
On the currency front, AUD/JPY bounced off its lows along with the stock market. However, AUD/JPY did not manage to go green on the day. This signal remains firmly bearish for the market although it is likely over-extended and due for a respite from selling pressure. Per my practice, I covered my latest short in the middle of the selling.
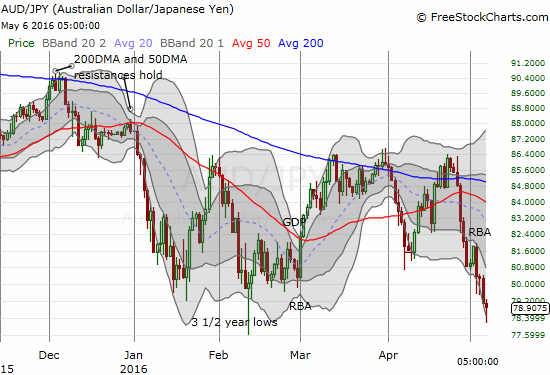
AUD/JPY still has that sinking feeling.
The U.S. dollar (DXY0) continued its rebound. In the last T2108 Update, I suggested the dollar was over-extended and due for a rally. This looks like a bottom to me given the hammer pattern at that low. Currency markets being currency markets, I will not be surprised to see this bottom get some kind of retest. After all, markets are pretty much daring the Fed to get serious about hiking rates anytime in our lifetime.
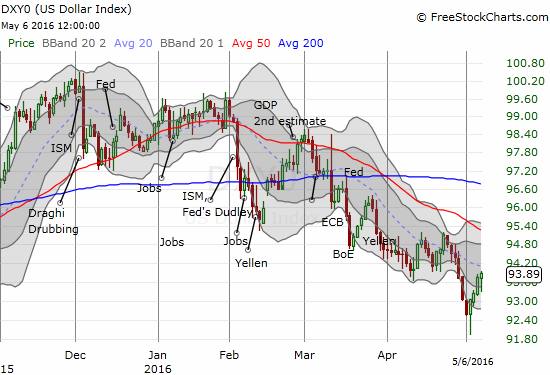
The U.S. dollar index may have hit rock bottom for now.
The 30-day Fed Fund Futures are still pricing in the next rate hike for December. The odds jumped significantly in the wake of the jobs report. This signal is not worth much unless the odds shift in time.
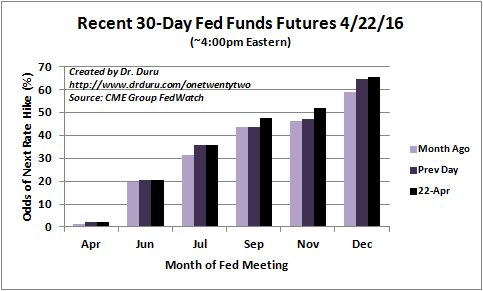
The April jobs report helped make a next rate hike in December look much more likely.
For readers interested in reviewing my trading rules for an oversold T2108, please see my post in the wake of the August Angst, “How To Profit From An EPIC Oversold Period“, and/or review my T2108 Resource Page.
Reference Charts (click for view of last 6 months from Stockcharts.com):
S&P 500 or SPY
U.S. Dollar Index (U.S. dollar)
EEM (iShares MSCI Emerging Markets)
VIX (volatility index)
VXX (iPath S&P 500 VIX Short-Term Futures ETN)
EWG (iShares MSCI Germany Index Fund)
CAT (Caterpillar).
IBB (iShares Nasdaq Biotechnology).
(Reload page and/or click on the image, if it is not correct. At time of writing, server is having cache issues)
Daily T2108 vs the S&P 500

Black line: T2108 (measured on the right); Green line: S&P 500 (for comparative purposes)
Red line: T2108 Overbought (70%); Blue line: T2108 Oversold (20%)
Weekly T2108

*
All charts created using
unless otherwise stated
The charts above are the my LATEST updates independent of the date of this given T2108 post. For my latest T2108 post click here.
(T2108 measures the percentage of stocks trading above their respective 40-day moving averages [DMAs]. It helps to identify extremes in market sentiment that are likely to reverse. To learn more about it, see my T2108 Resource Page. You can follow real-time T2108 commentary on twitter using the #T2108 hashtag. T2108-related trades and other trades are occasionally posted on twitter using the #120trade hashtag. T2107 measures the percentage of stocks trading above their respective 200DMAs)
T2108 Status: 61.7%
T2107 Status: 56.9%
VIX Status: 14.7
General (Short-term) Trading Call: cautiously bearish
Active T2108 periods: Day #59 over 20%, Day #58 over 30%, Day #55 over 40%, Day #52 over 50%, Day #48 over 60%, Day #4 under 70%
Related links:
The T2108 Resource Page
Expanded daily chart of T2108 versus the S&P 500
Expanded weekly chart of T2108
Full disclosure: long USD/JPY, short GBP/JPY


