
London Bridge Is Falling Down, Falling Down
Well, not literally, but the British pound has definitely seen better days. And the worse it gets for the pound, the better is gets for those who followed our analysis as we’ve been shorting this market almost right from the top. The support, however, is just around the corner. What’s next?
EUR/USD and Important Breakdowns
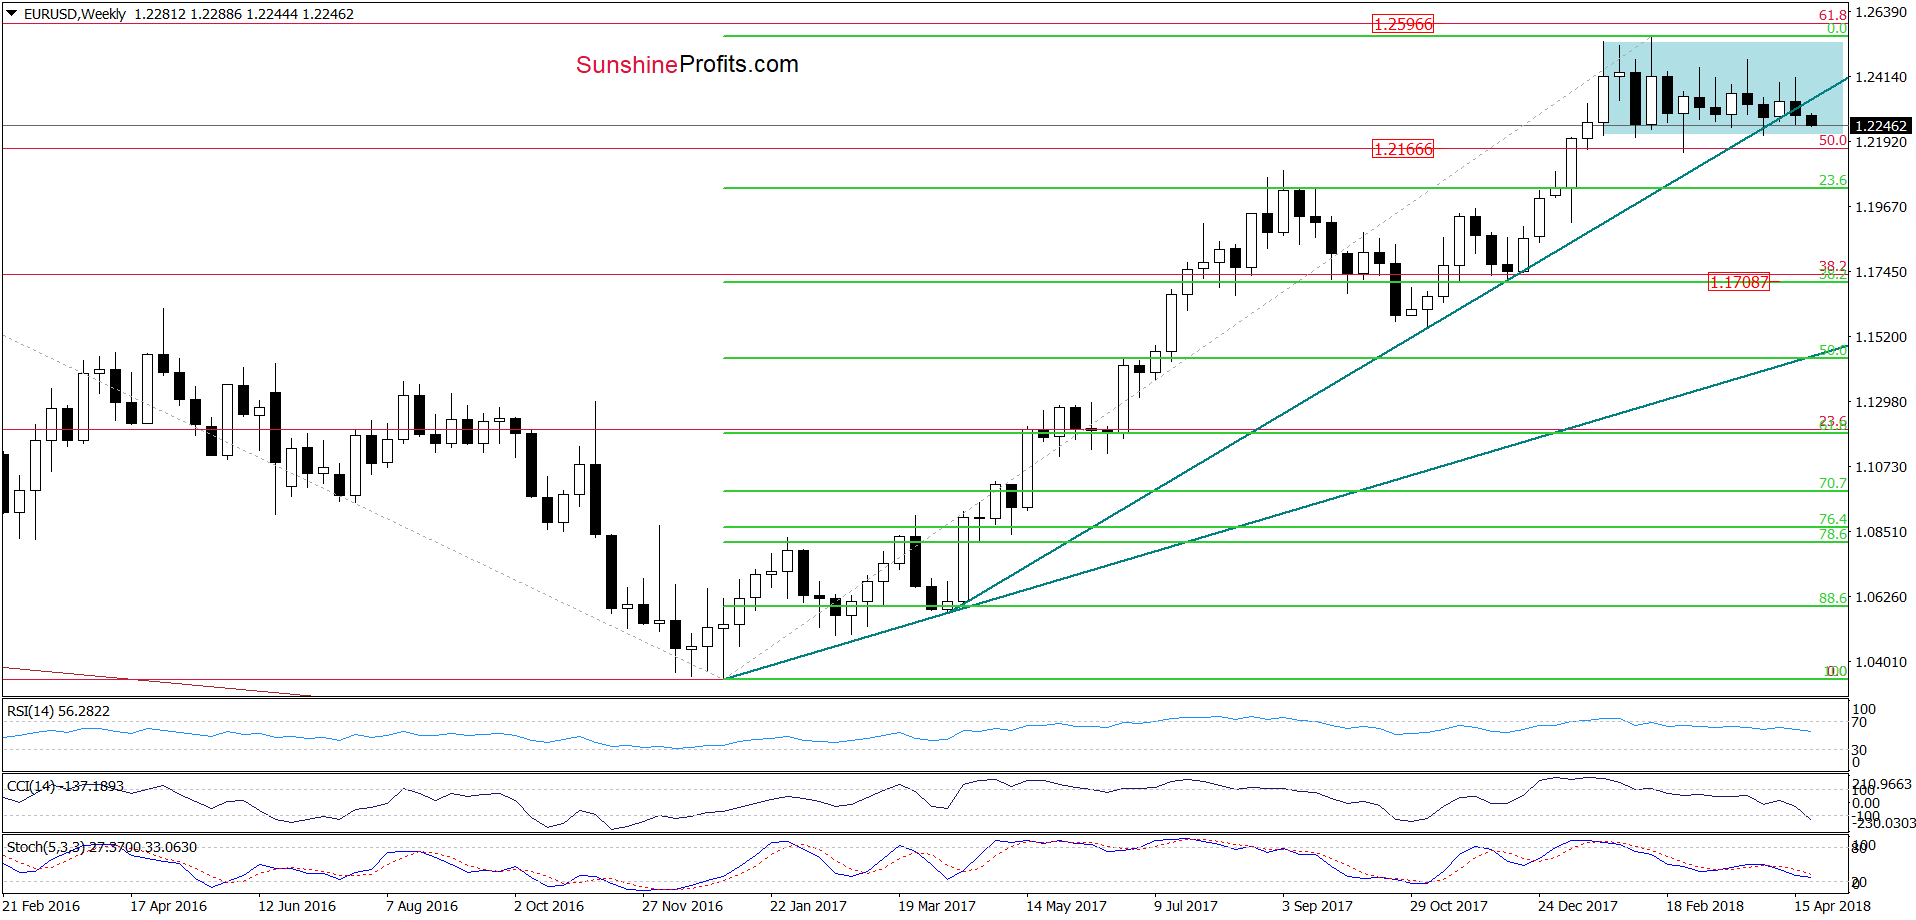
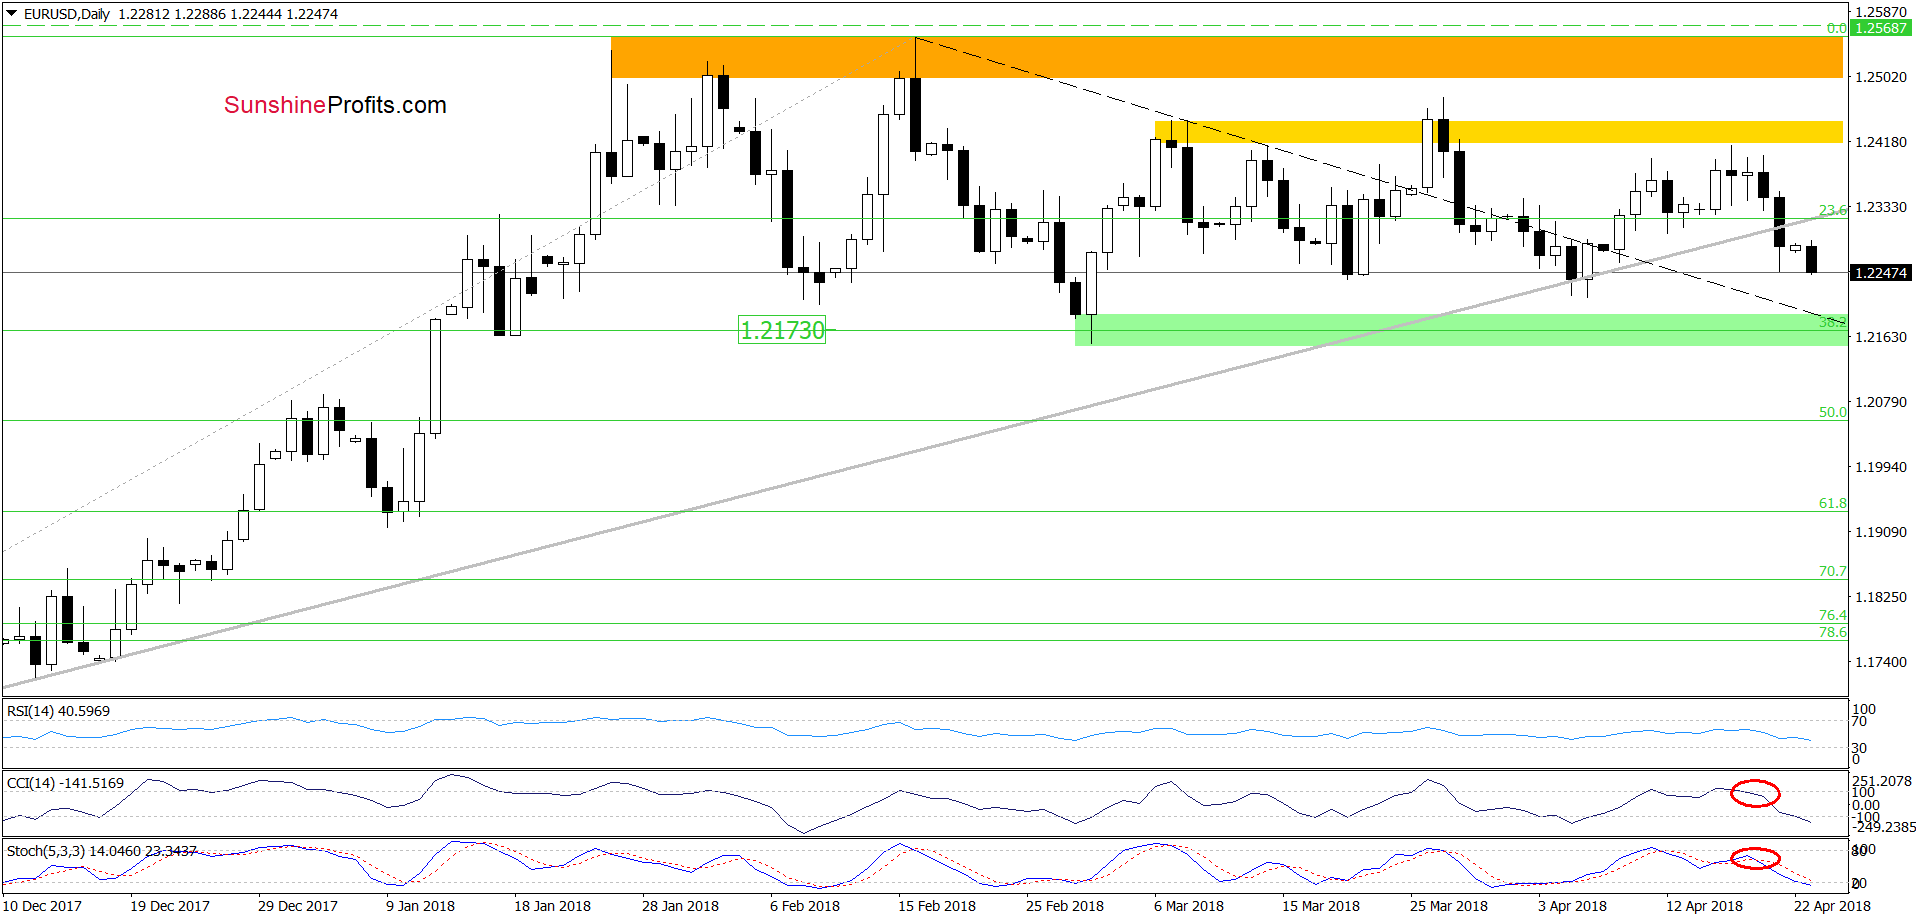
Although the pair pulled back before the Friday’ session’s closure, currency bears managed to close not only the day, but also the whole week below the medium-term grey support line (seen on the daily chart) and the long-term green line (marked on the weekly chart).
In this way, the exchange rate broke under these two important support lines, opening the way to lower values of EUR/USD.
How low could the exchange rate go?
In our opinion, the first downside target will be the green support zone created by the 38.2% Fibonacci retracement, the March low and the previously-broken black dashed support line based on February and early March highs.
Nevertheless, if the pair moves below this area (which will be equal to the breakdown under the lower border of the blue consolidation seen on the weekly chart), we could see a test of the next Fibonacci retracements: 50% at 1.2053, 61.8% at 1.1935 (this level is also supported by the early January lows (both marked on the daily chart) or even the 38.2% retracement based on the entire January 2017-February 2018 upward move at 1.1708 (seen on the weekly chart above).
Finishing today’s commentary on this currency pair it is worth noting that the long-term indicators generated the sell signals, increasing the probability of further deterioration in the last week of the month.
GBP/USD Declines Reward Sellers
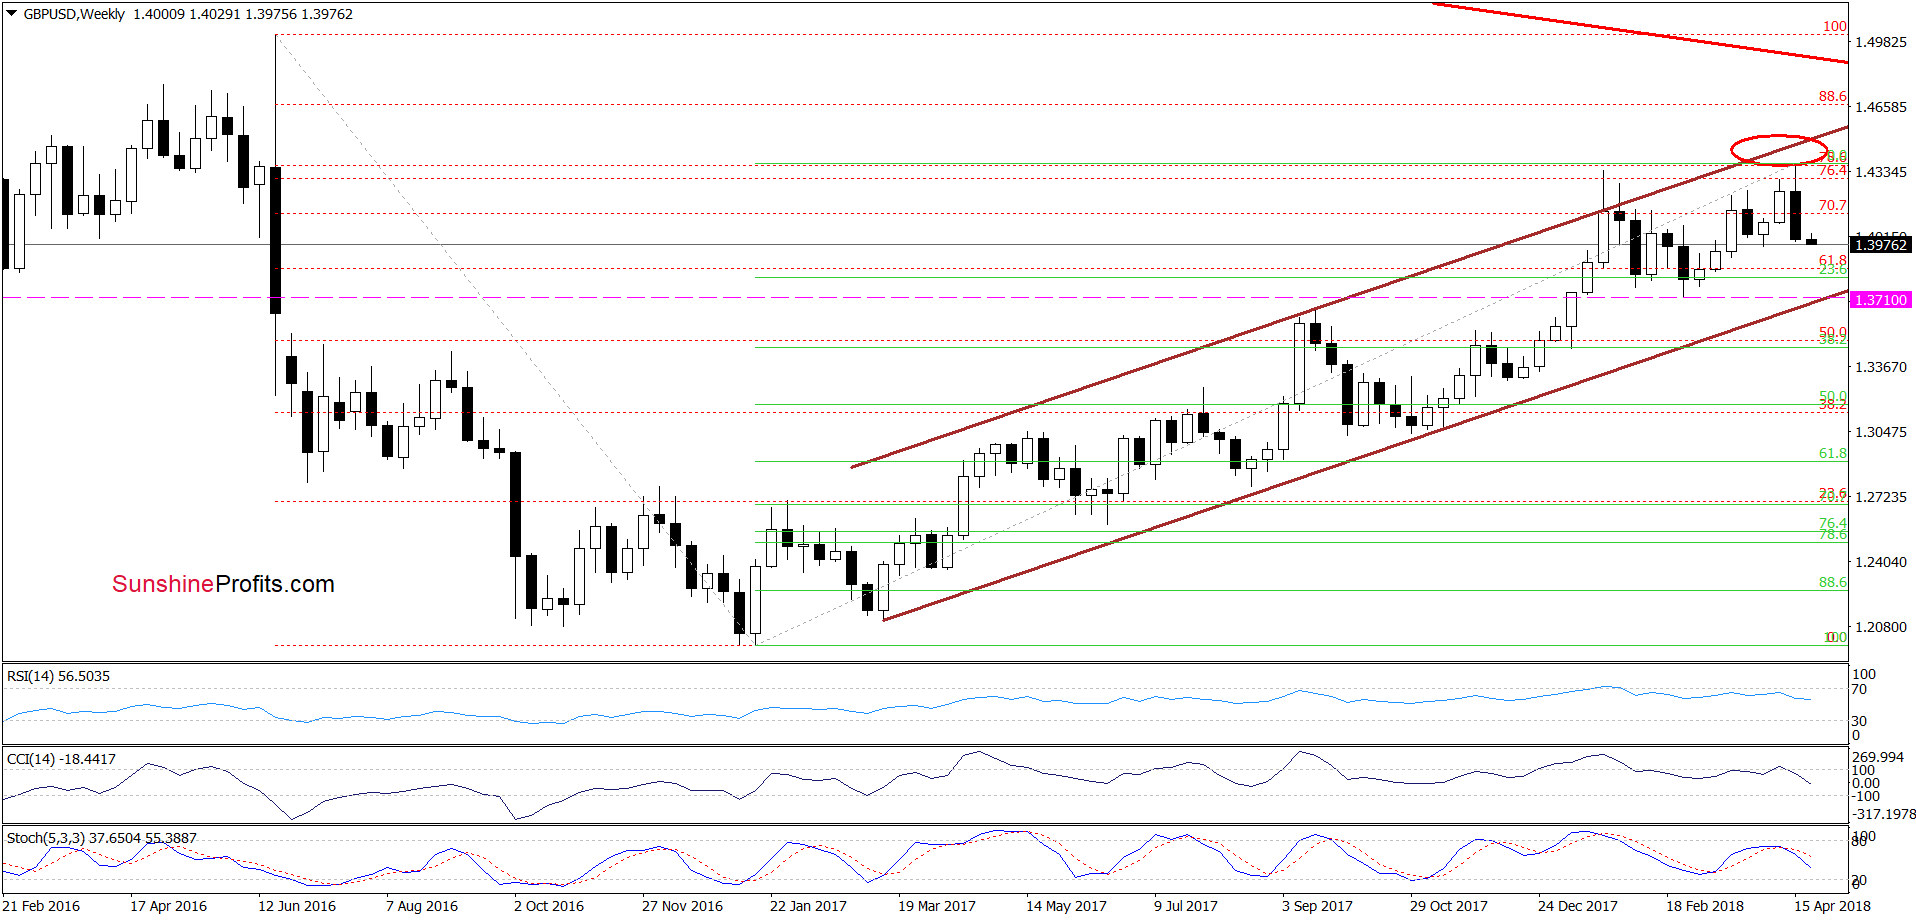
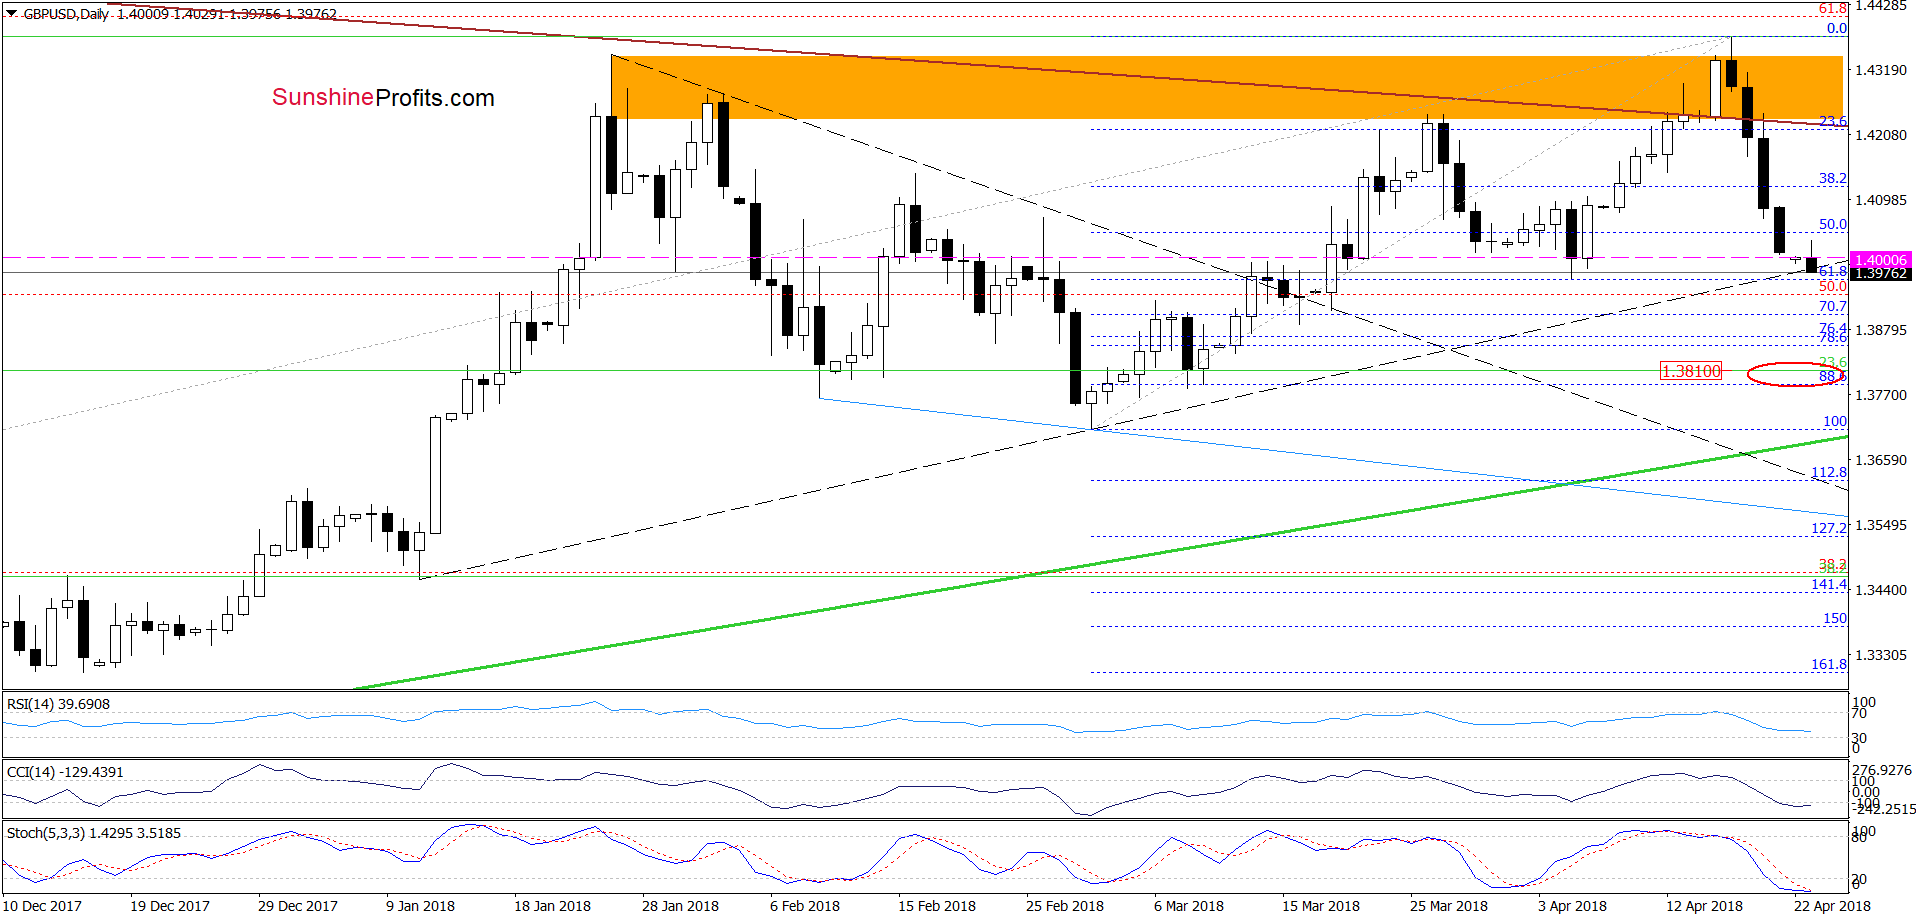
On Friday we wrote that thanks to the Wednesday’s decline, the pair invalidated also the earlier breakout above the long-term brown declining resistance line (based on the June and August 2015 peaks) and verified this drop on the following day which accelerated declines, making our short positions more profitable.
Additionally, the weekly indicators (the CCI and the Stochastic Oscillator) also generated the sell signals, increasing the probability of further deterioration in the coming week(s).
Where will GBP/USD head next if it extends losses from current levels?
In our opinion, the first downside target will be around 1.3964-1.4000, where the early April lows (in terms of an intraday and closing prices) are.
From today’s point of view, we see that the situation developed in tune with the above scenario and GBP/USD not only slipped to our first downside target, but also moved below it earlier today.
Taking this fact into account and combining it with the lack of buy signals generated by the indicators, we think that the pair will decline even lower in the coming days.
Where could the bears take the exchange rate?
In our opinion, if the sellers manage to break below this zone, we could see a downward move even to around 1.3786-1.3812, where the early March lows (in terms of an intraday and closing prices) and the 88.6% Fibonacci retracement are.
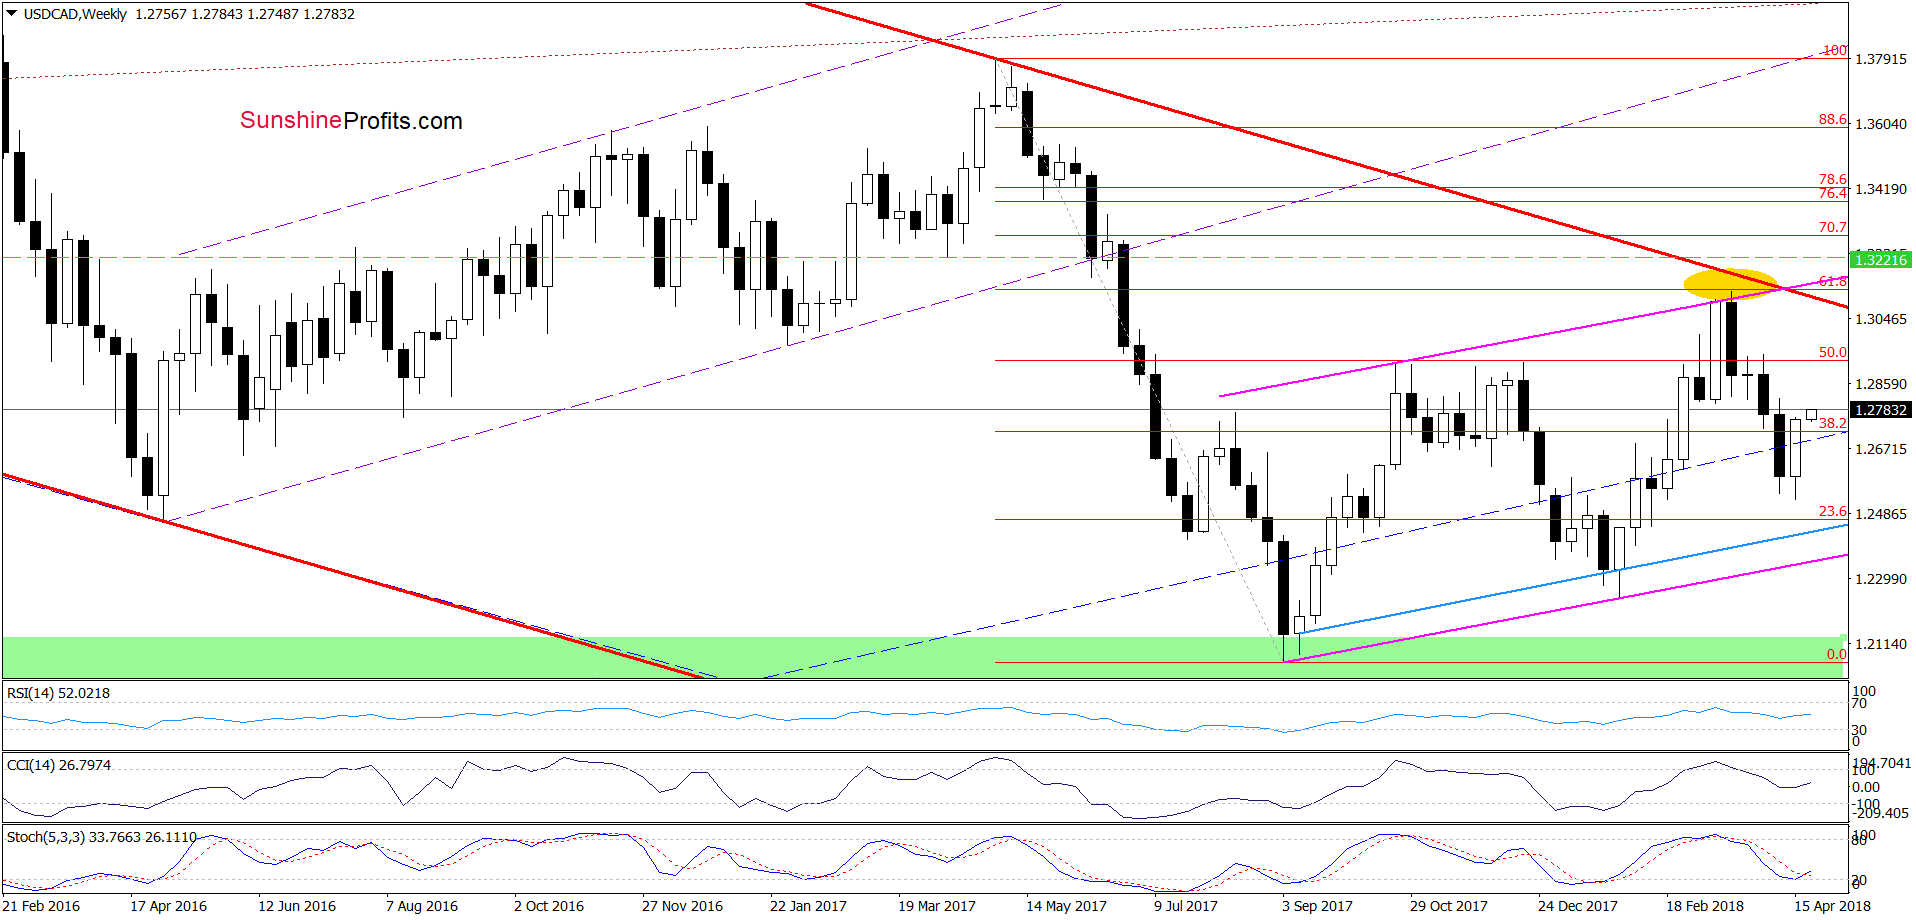
On top of that, this area (marked with the red ellipse) is also supported by the 23.6% Fibonacci retracement based on the entire 2017-2018 upward move and the lower border of the brown rising trend channel (seen on the weekly chart), which increases its importance for both sides of the market.
USD/CAD and Its Stop Loss - Not as Bad as It Seems
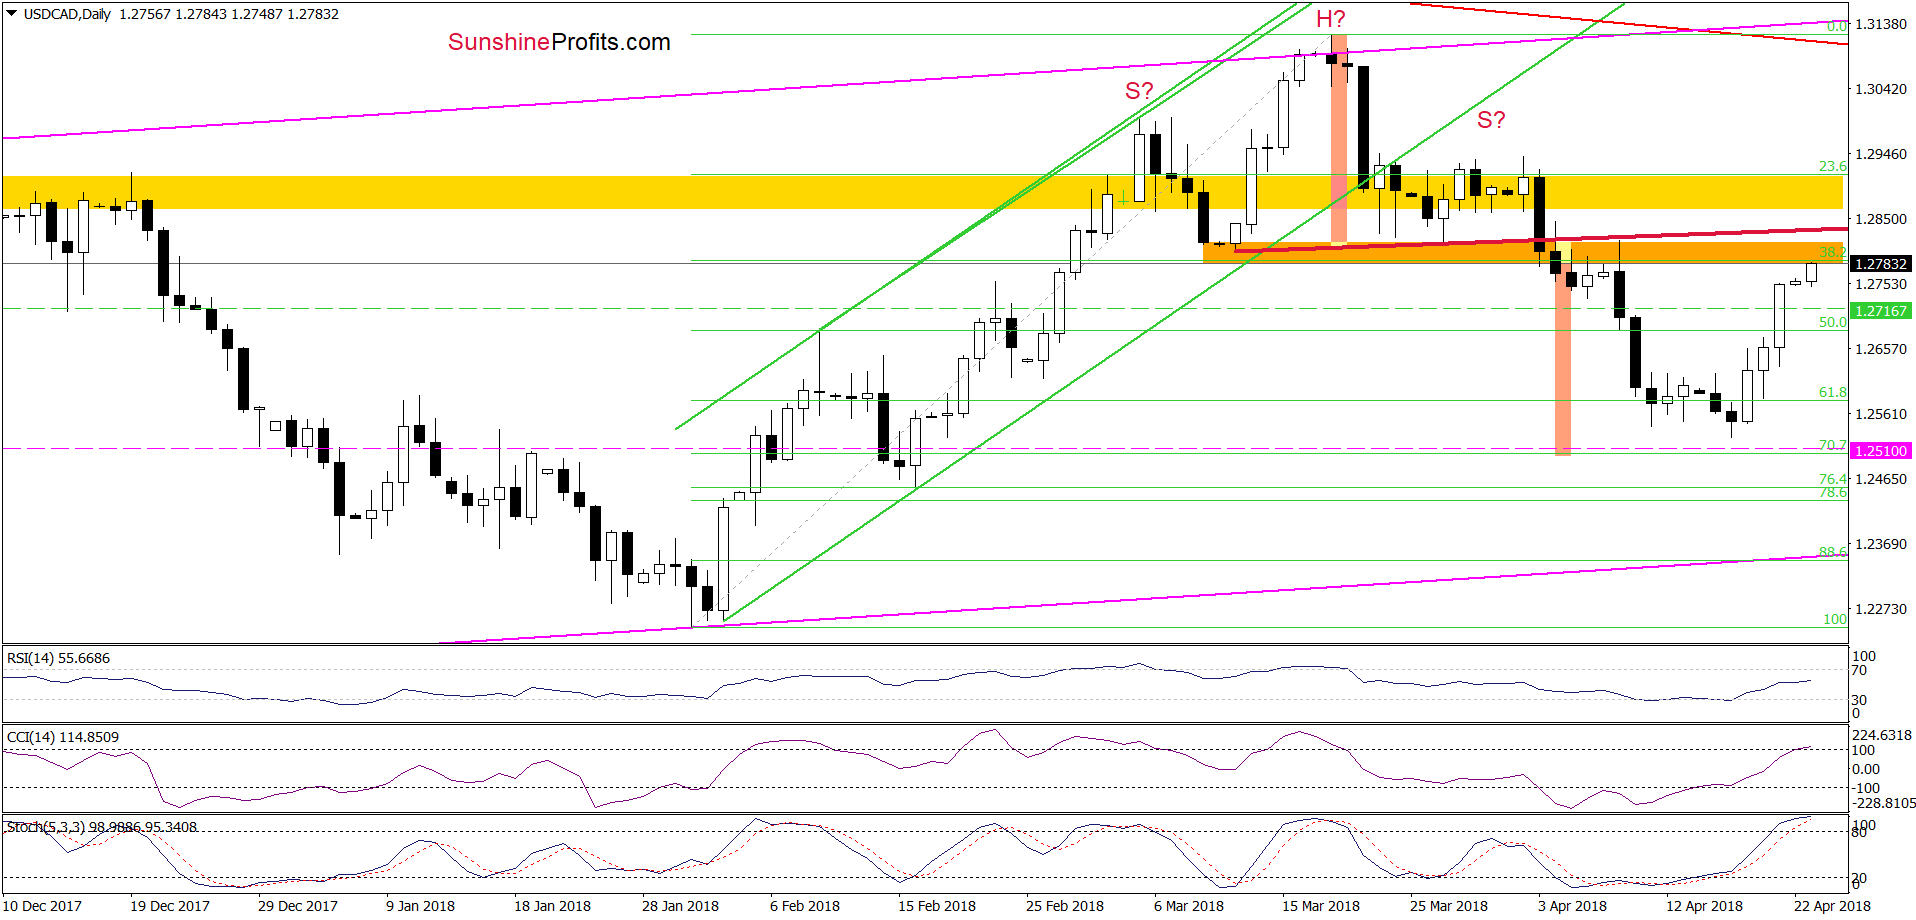
Looking at the daily chart, we see that USD/CAD moved sharply higher on Friday and the stop-loss order was activated before the session ended. Well, it’s a stop-loss order just technically because we had opened the short position practically right at the 2018 top (on March 19, when USD/CAD was trading at around 1.3116), so Friday’s transaction was actually taking the remaining profits off the table. We closed most of the position (80%) on April 11, when USD/CAD was trading at around 1.2601.
Naturally, the question remains where the Canadian dollar will go from here. Taking into account the current price, we think that the pair will test the strength of the previously-broken red line based on the mid- and late March lows (the neck line of the head and shoulders formation marked on the daily chart) in the very near future. The behavior of the buyer and the sellers in this area will give us more clues about future moves.
Nevertheless, the CCI and the Stochastic Oscillator increased to their overbought areas, which in combination with the above-mentioned resistance and the proximity to the yellow resistance zone suggests that reversal may be just around the corner.
If this is the case and we see any reliable sign of currency bulls’ weakness, we’ll consider re-opening short positions. As always, we will keep you -our subscribers- informed should ...
more

